Virtual Brand Data Scraping Case Study - How One Operator Runs 22 Virtual Brands From One Facil
Author : FoodData Scrape | Published On : 29 Jul 2026
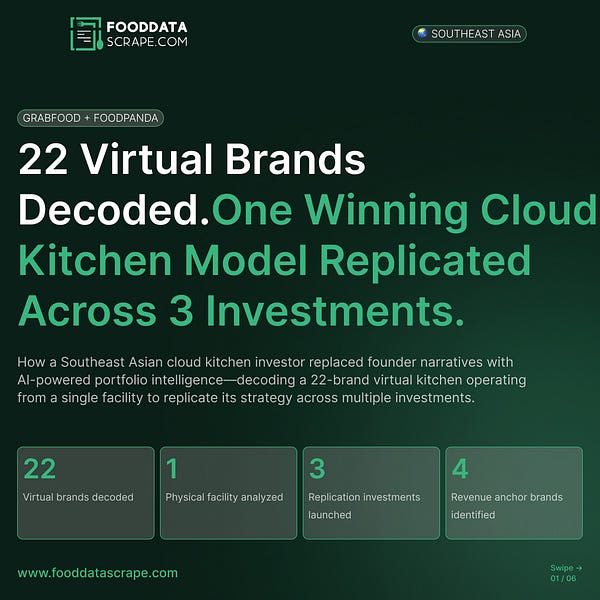
How a cloud kitchen platform investor used virtual brand data scraping and AI-assisted portfolio decoding to reverse-engineer a highly successful 22-brand model from a single facility and replicate it across 3 investments.
22-Virtual brands decoded
1-Physical facility
3-Replication investments
4-Portfolio coverage
Who the client is
The client is a cloud kitchen platform investor evaluating multi-brand operator strategies across Southeast Asia. The investor had identified one operator running an unusually successful 22-brand portfolio from a single facility and needed reliable virtual brand data intelligence to decode the model before scaling it across their platform investments. Names are anonymized for confidentiality; metrics are shown exactly as delivered.
Objectives
What they wanted to achieve
- Decode the 22-virtual-brand portfolio structure
- Identify which brands drove revenue versus which were cuisine fillers
- Track menu overlap and cross-brand pricing strategy
- Map promo cadence and rank-velocity per brand
- Replace founder explanations with merchant-level evidence
- Replicate the winning model across 3 platform investments
The challenge
Multi-brand strategy is invisible from the outside
Multi-brand cloud kitchen strategies operate at a level of complexity that is invisible from any single platform view. A facility might run 22 brands, with overlapping menus, different price points, staggered promo cadences, and rank-engineering tactics — each tuned to capture a different slice of platform demand. Without merchant-level data tying every virtual brand back to one operator, replicating the model was impossible.
The solution
A 22-brand portfolio decoder
FoodDataScrape built a continuous GrabFood data scraping and foodpanda data extraction pipeline focused on the operator’s 22-brand portfolio, with cross-brand menu reconciliation and pricing decode. The build went live in four weeks.
Map all 22 brands
We identified all 22 virtual brands as belonging to the same operator via address, GPS, and kitchen-cluster matching.
Menu reconciliation
Cross-brand menu comparisons revealed which dishes were shared, which were brand-exclusive, and how pricing differed by brand.
Promo & rank decode
Per-brand promo cadence and platform-ranking velocity were tracked weekly to surface the orchestration logic.
The AI layer
How does AI-assisted multi-brand decoding work?
AI-assisted multi-brand decoding combines food delivery data scraping with classification models that match virtual brands to underlying operators — and analyzes menu overlap, pricing patterns, and promo cadence across brands to reveal portfolio strategy.
On top of the raw feed, an AI portfolio-analysis layer turned brand-level data into multi-brand cloud kitchen intelligence: it identified which brands were revenue anchors versus cuisine fillers, mapped menu overlap patterns, decoded the operator’s promo orchestration, and produced a complete portfolio-strategy decode. Each month the investor received refreshed portfolio analytics.
- Classified 22 virtual brands by revenue contribution archetype
- Identified 4 revenue-anchor brands accounting for ~72% of estimated orders
- Surfaced shared-kitchen menu overlap pattern across 18 of 22 brands
- Decoded promo orchestration: staggered cadence across 5-brand sub-clusters
Data captured
What data we captured
The pipeline captured a full multi-brand portfolio data intelligence view:
Virtual brand names
Underlying operator attribution
Per-brand menus & pricing
Cross-brand menu overlap
Promo cadence per brand
Platform ranking trend
Review velocity per brand
Cuisine cluster classification
Capture timestamp
sources.scope
sourcemethodfieldsGrabFoodGrabFood data scraping22 brands · menu · price · rankingfoodpandafoodpanda data extraction22 brands · promo · reviews · velocityAI portfolio layerMulti-brand decoderevenue archetype classification
BEFORE VS AFTER
Before vs after comparison
MetricBeforeAfter (FoodDataScrape)Brand-to-operator linkageUnknown / scatteredAll 22 brands tied to one operatorPortfolio structureFounder explanationRevenue archetypes decodedMenu overlap insightInvisibleShared-kitchen pattern mappedPromo orchestrationPer-brand observationStaggered cluster cadence revealedReplication feasibilityUntested theory3 replications launched on platform investmentsInvestment thesisFounder-narrativeData-decoded portfolio strategy
ROI impact
From Assumption to Measurable ROI
22
Virtual brands decoded
Full portfolio of one SEA operator unified into one analytical view.
3
Replication investments
Same portfolio strategy now running on 3 platform investments.
72%
Revenue concentration
4 anchor brands drive most volume — fillers serve different role.
4 weeks
Time to live
Pipeline delivered fast enough to inform a live investment cycle.
The decoded portfolio strategy now informs every multi-brand operator the investor evaluates — and has become a screening framework that separates real multi-brand expertise from cuisine-spam approaches.
In the client’s words
“Multi-brand strategies look like 22 random brands from the outside. The decode showed us the underlying architecture — anchor brands, fillers, shared kitchens, staggered promos — and gave us a replicable playbook.”
— Managing Partner, cloud kitchen investor (name withheld)
Why they chose FoodDataScrape
- Specialists in cloud kitchen data scraping across SEA
- GrabFood & foodpanda coverage out of the box
- AI-assisted multi-brand portfolio decoding
- Cross-brand menu reconciliation logic
- Compliance-aware sourcing and dedicated SEA analyst support
- Live in four weeks with a free proof-of-concept first
Read More- https://www.fooddatascrape.com/virtual-brand-data-scraping-22-brands.php
Originally Submitted at: https://www.fooddatascrape.com/index.php
#VirtualBrandDataScraping,
#ScrapeVirtualRestaurantData,
#VirtualRestaurantDataScraping,
#ExtractVirtualBrandData,
#MultiBrandRestaurantDataExtraction,
