Scraping Cruise Industry 2026 for Cabin Pricing Data
Author : Travel Scrape | Published On : 01 Oct 2026
Introduction
The global cruise market is entering 2026 with unusually strong demand signals. CLIA reported that global ocean-going cruise passenger volume reached a historic 37.2 million in 2025, while industry forecasts point toward continued growth in 2026. AAA has projected 21.7 million Americans will cruise in 2026, representing another year of growth.
For businesses tracking this expansion, Scraping Cruise Industry 2026 data has become increasingly important because headline passenger numbers alone cannot explain how demand is affecting individual cabins, itineraries, sailing dates, and price points.
Cruise Data Scraping enables analysts to capture cabin-level information repeatedly across booking windows, destinations, ships, departure dates, occupancy indicators, promotional offers, and fare categories. Instead of viewing cruise pricing as a static number, businesses can construct a time series showing how prices react as inventory becomes constrained.
Scraping Cabin Pricing Data provides an especially useful lens because cruise inventory is highly segmented. An inside cabin, ocean-view room, balcony cabin, suite, and premium accommodation can experience completely different pricing trajectories on the same sailing.
Why Cabin-Level Pricing Is Becoming a Demand Signal?
Cruise pricing increasingly resembles other dynamic travel categories. Cruise lines are using dynamic fares, tiered packages and additional fees, making the relationship between booking timing and final price more complex. Industry reporting in 2026 has also highlighted the growing importance of close-in bookings and pricing power on popular sailings.
This creates an important analytical opportunity: Demand Forecasting can be strengthened by observing price movement rather than waiting for confirmed passenger-volume statistics.
Suppose an itinerary starts with an inside cabin at $899 and a balcony cabin at $1,499. Several weeks later, the inside cabin rises to $1,049 while the balcony increases to $1,799. If suites simultaneously become unavailable, the combined movement can indicate tightening inventory.
The key is not simply recording the highest price. Analysts need to record the direction, speed, frequency, and magnitude of price changes.
Illustrative Cabin Pricing Dataset
| Sailing ID | Region | Ship Type | Departure Month | Cabin Type | Initial Fare ($) | Week 4 Fare ($) | Week 8 Fare ($) | Week 12 Fare ($) | Price Increase % | Promo Discount % | Inventory Signal | Demand Score |
|---|---|---|---|---|---|---|---|---|---|---|---|---|
| CR-101 | Caribbean | Large | Jan | Inside | 799 | 849 | 929 | 999 | 25.0% | 5% | Tightening | 82 |
| CR-101 | Caribbean | Large | Jan | Ocean View | 999 | 1,049 | 1,149 | 1,249 | 25.0% | 4% | Tightening | 85 |
| CR-101 | Caribbean | Large | Jan | Balcony | 1,299 | 1,399 | 1,549 | 1,699 | 30.8% | 3% | Very Tight | 91 |
| CR-101 | Caribbean | Large | Jan | Suite | 2,799 | 2,999 | 3,249 | 3,599 | 28.6% | 2% | Scarce | 95 |
| CR-102 | Mediterranean | Premium | May | Inside | 899 | 919 | 979 | 1,049 | 16.7% | 8% | Stable | 71 |
| CR-102 | Mediterranean | Premium | May | Ocean View | 1,099 | 1,149 | 1,249 | 1,349 | 22.8% | 6% | Tightening | 78 |
| CR-102 | Mediterranean | Premium | May | Balcony | 1,499 | 1,599 | 1,749 | 1,949 | 30.0% | 4% | Very Tight | 88 |
| CR-102 | Mediterranean | Premium | May | Suite | 3,099 | 3,299 | 3,699 | 4,099 | 32.3% | 2% | Scarce | 94 |
| CR-103 | Alaska | Large | Jul | Inside | 1,199 | 1,249 | 1,349 | 1,499 | 25.0% | 3% | Tightening | 86 |
| CR-103 | Alaska | Large | Jul | Ocean View | 1,499 | 1,599 | 1,749 | 1,949 | 30.0% | 2% | Very Tight | 92 |
| CR-103 | Alaska | Large | Jul | Balcony | 1,899 | 2,049 | 2,299 | 2,599 | 36.9% | 2% | Scarce | 97 |
| CR-103 | Alaska | Large | Jul | Suite | 3,799 | 4,099 | 4,499 | 4,999 | 31.6% | 1% | Scarce | 98 |
| CR-104 | Europe | River | Sep | Standard | 1,699 | 1,749 | 1,849 | 1,949 | 14.7% | 7% | Stable | 69 |
| CR-104 | Europe | River | Sep | Balcony | 2,099 | 2,199 | 2,349 | 2,499 | 19.1% | 5% | Tightening | 77 |
| CR-104 | Europe | River | Sep | Suite | 3,199 | 3,399 | 3,699 | 3,999 | 25.0% | 3% | Very Tight | 89 |
Note: Figures in this table are illustrative modeling values created to demonstrate the analytical structure, not reported operator fares.
From Price Changes to Demand Intelligence
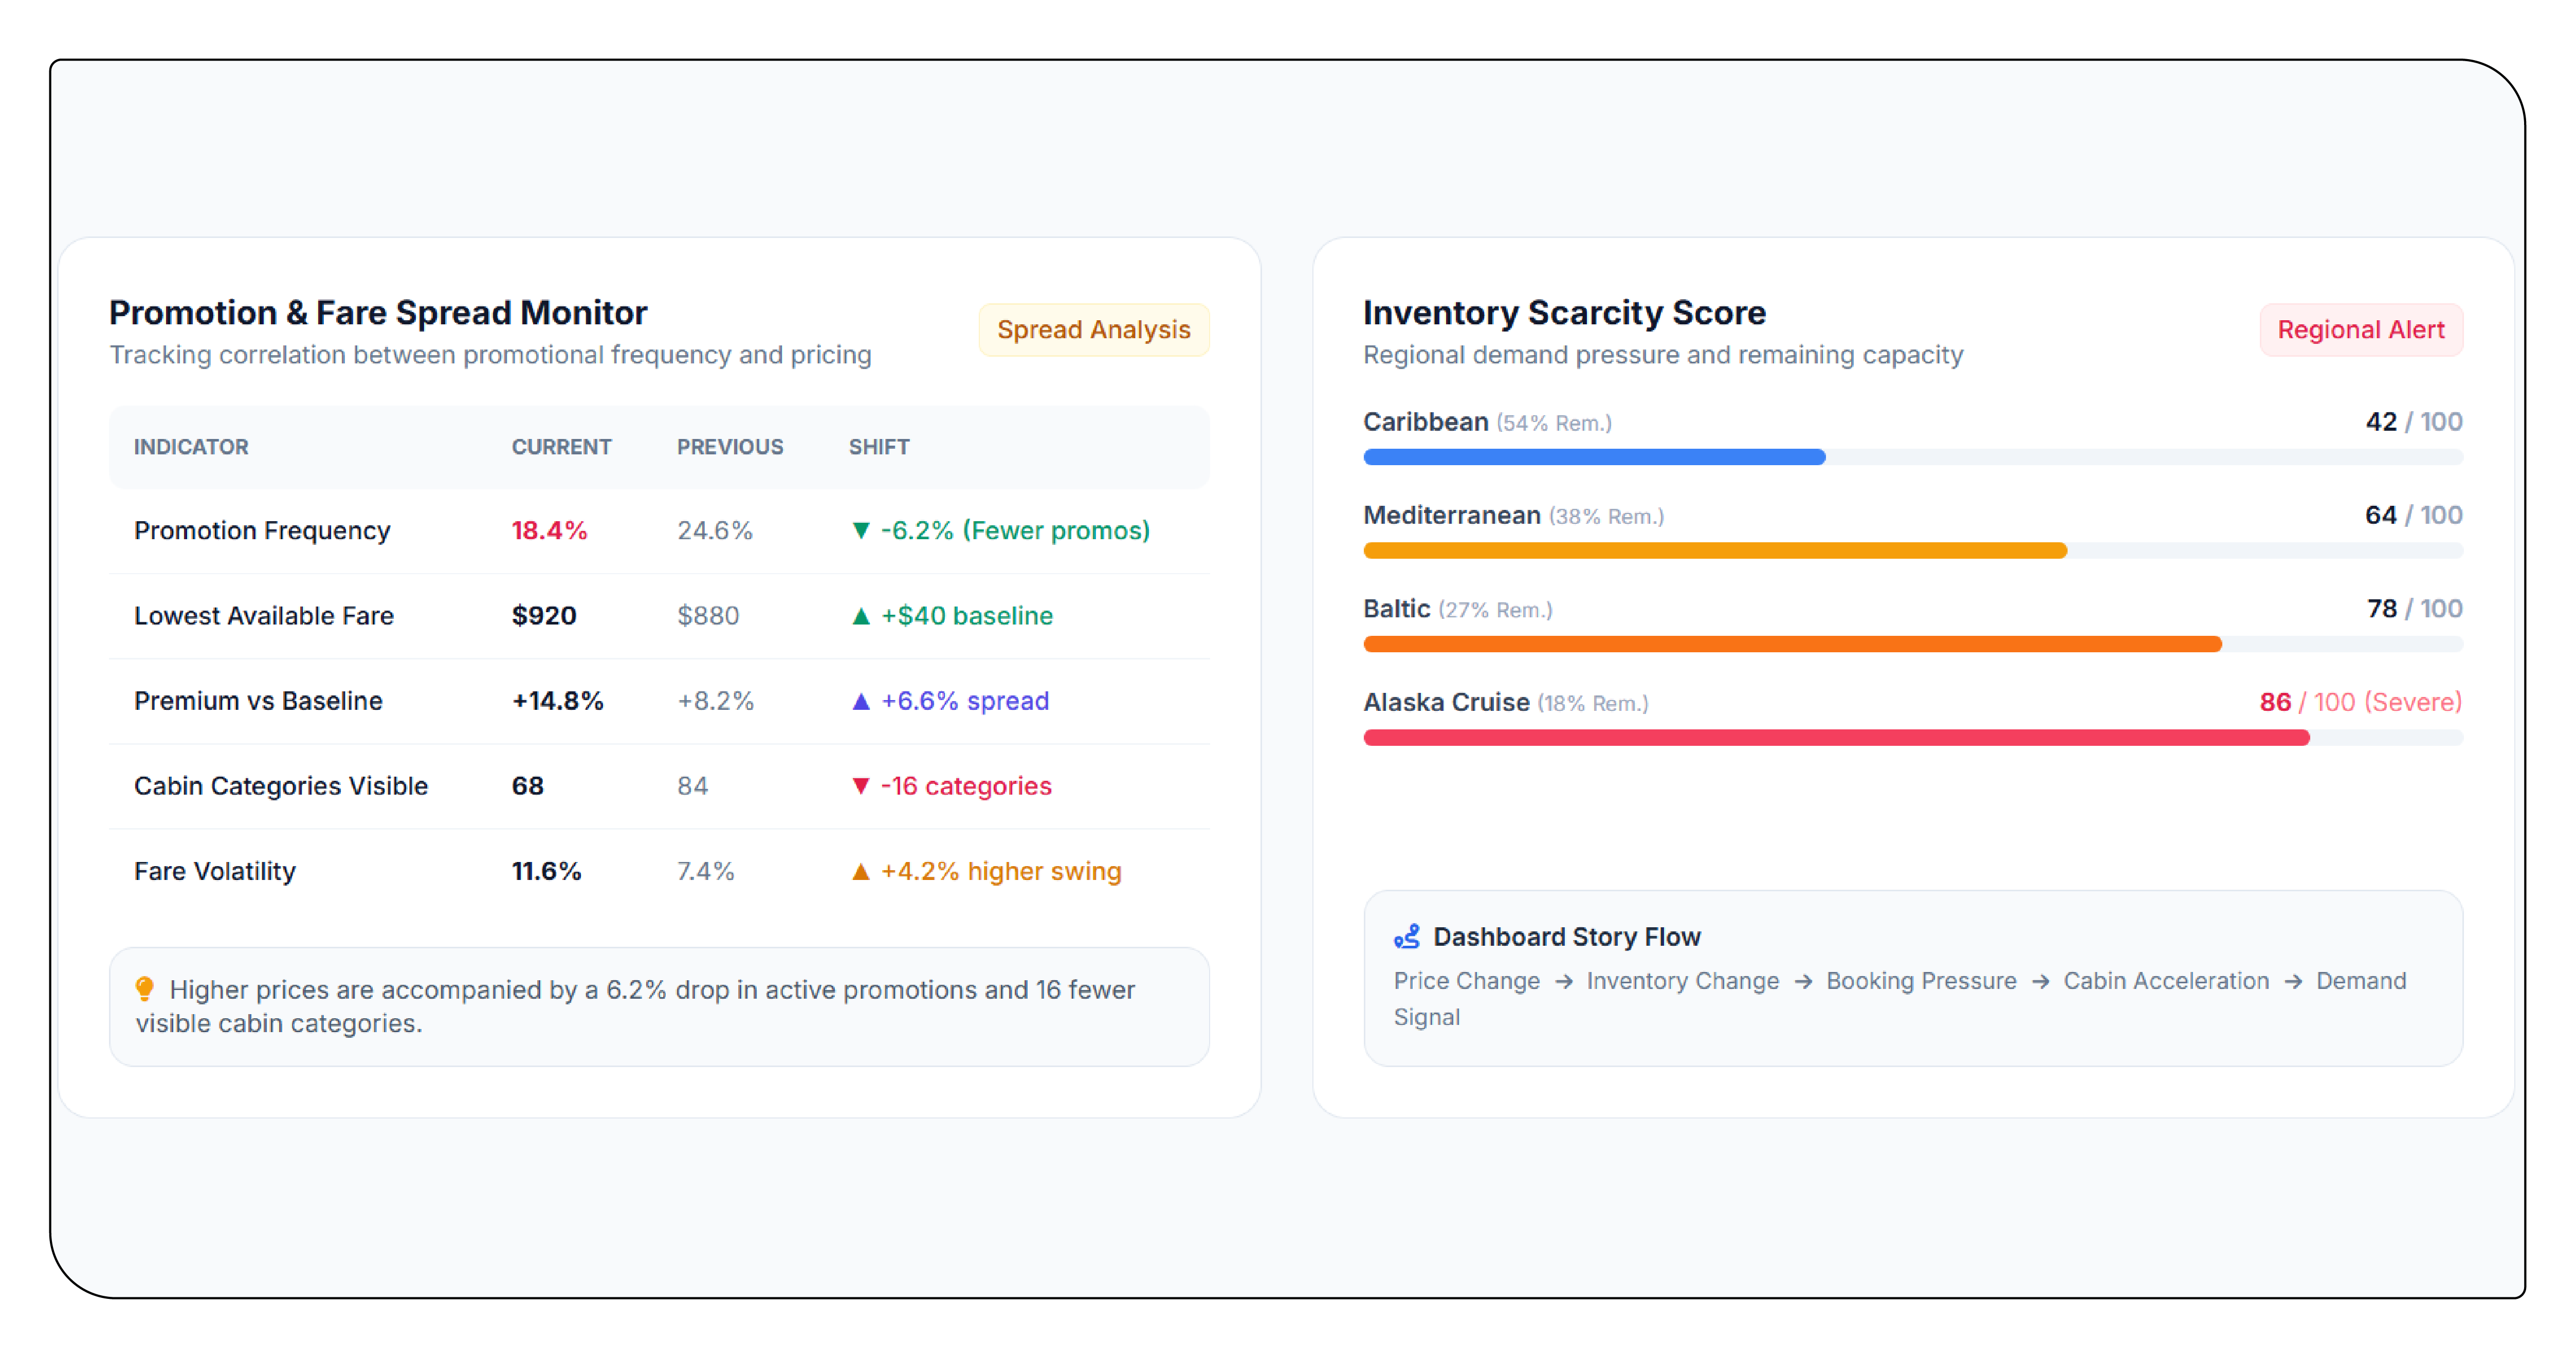
The real value emerges when individual observations are transformed into indicators. A 5% price increase across an itinerary may not mean much if inventory remains abundant. However, a 20% increase combined with shrinking cabin availability, fewer promotions, and shorter booking windows can indicate much stronger demand.
This is where Cruise Record-Breaking Demand tracking becomes measurable through repeated observations.
Analysts can calculate several indicators:
- Average cabin fare by sailing
- Price growth by booking window
- Cabin-level price acceleration
- Fare spread between cabin categories
- Promotion frequency
- Days until departure
- Number of visible cabin categories
- Lowest available fare
- Premium over baseline fare
- Price volatility
- Inventory scarcity score
A particularly useful measure is cruise pricing intelligence 2026, which combines these signals into a continuously updated market view. Instead of asking whether cruises are generally expensive, analysts can identify which destinations, sailing periods, ships, and cabin categories are experiencing the strongest pricing pressure.
Understanding Cabin Fare Differences
Cabin segmentation provides another layer of insight. A balcony cabin can appreciate significantly faster than an inside cabin when travelers prioritize views and outdoor space. Similarly, premium suites may show strong price increases even when standard cabins remain comparatively stable.
This makes Cruise Pricing Intelligence useful for revenue teams, travel agencies, cruise marketplaces, investors, and destination analysts.
A structured cruise fare difference dataset by cabin type can calculate the absolute and percentage gap between categories over time.
For example, analysts might monitor:
Balcony Fare − Inside Fare
and
Suite Fare ÷ Inside Fare
A growing balcony-to-inside premium can signal stronger preference for upgraded accommodations. A narrowing premium could indicate weaker demand for premium inventory or increased promotional activity.
Comparing Destinations and Booking Windows
Demand rarely develops uniformly across the cruise market. Caribbean, Mediterranean, Alaska, Northern Europe, Asian and expedition itineraries can follow different booking cycles.
The following illustrative dataset demonstrates how a market intelligence system can compare demand signals across regions.
Illustrative Regional Demand & Pricing Intelligence Dataset
| Region | Avg Sailing Fare ($) | 30-Day Price Growth % | 60-Day Price Growth % | 90-Day Price Growth % | Avg Balcony Premium % | Avg Suite Premium % | Promo Frequency % | Avg Booking Lead Days | Cabin Scarcity Index | Demand Index | YoY Demand Signal % |
|---|---|---|---|---|---|---|---|---|---|---|---|
| Caribbean | 1,485 | 8.6 | 16.4 | 25.7 | 36.2 | 112.4 | 18 | 142 | 84 | 91 | 12.8 |
| Mediterranean | 1,672 | 6.9 | 14.8 | 23.5 | 39.8 | 118.7 | 22 | 156 | 79 | 86 | 10.9 |
| Alaska | 2,145 | 10.7 | 21.5 | 34.2 | 42.7 | 124.9 | 14 | 181 | 93 | 96 | 15.4 |
| Northern Europe | 1,921 | 7.3 | 15.9 | 26.1 | 38.4 | 116.2 | 19 | 168 | 82 | 88 | 11.7 |
| Asia | 1,354 | 5.8 | 11.7 | 19.6 | 31.5 | 98.7 | 27 | 119 | 68 | More 
|