Quick Commerce Data API Powers Real-Time Insights
Author : iweb0303 iweb0303 | Published On : 19 Nov 2026
Introduction
Quick commerce has transformed the way consumers purchase groceries, personal care products, snacks, beverages, and household essentials. Customers increasingly expect products to arrive within minutes, making real-time inventory visibility, competitive pricing, accurate product information, and efficient delivery operations essential for success. For brands, retailers, manufacturers, and market researchers, understanding these rapidly changing conditions requires access to timely and structured digital commerce data.
A Quick Commerce Data API helps businesses collect, organize, and analyze product listings, prices, discounts, availability, and other relevant information from supported digital commerce sources. Instead of manually checking product pages throughout the day, organizations can use automated data pipelines to develop a consistent view of market activity. These insights support pricing decisions, assortment planning, promotional analysis, and regional demand assessment.
For example, a Blinkit data scraping API can support the collection of product-level information from accessible Blinkit listings, subject to platform permissions and technical availability. Similarly, a Zepto data extraction API can help businesses structure relevant product and pricing information from Zepto, enabling comparisons across categories, locations, and competing brands.
Understanding how Instamart, Zepto, and Blinkit data can be collected and analyzed allows businesses to move beyond occasional market observations. With reliable data collection, validation, and analysis, quick commerce intelligence becomes a valuable resource for improving operational efficiency and strengthening competitive positioning.
What Is a Quick Commerce Data API?
A Quick Commerce Data API is an integration layer that allows applications to access or exchange structured information programmatically. Depending on its implementation, it may connect to an authorized platform API, a licensed data provider, or a compliant web data extraction pipeline that converts publicly accessible information into structured records.
The resulting information can include product names, brands, pack sizes, listed prices, discounted prices, promotional labels, category classifications, availability indicators, and collection timestamps. Where supported and lawfully accessible, datasets may also include ratings, review counts, seller details, and delivery estimates.
The primary advantage is consistency. Instead of relying on scattered screenshots or manually maintained spreadsheets, businesses can establish repeatable processes for gathering and analyzing market information.
However, a third-party extraction service should not automatically be described as an official platform API. Access methods, available fields, refresh frequency, and permitted uses depend on the source platform, its terms, and the data provider's capabilities.
Understanding the Instamart API
Swiggy Instamart operates in the competitive quick commerce market, where grocery selection, product availability, pricing, and promotional activity can vary by location and time. These changes create a need for timely market intelligence.
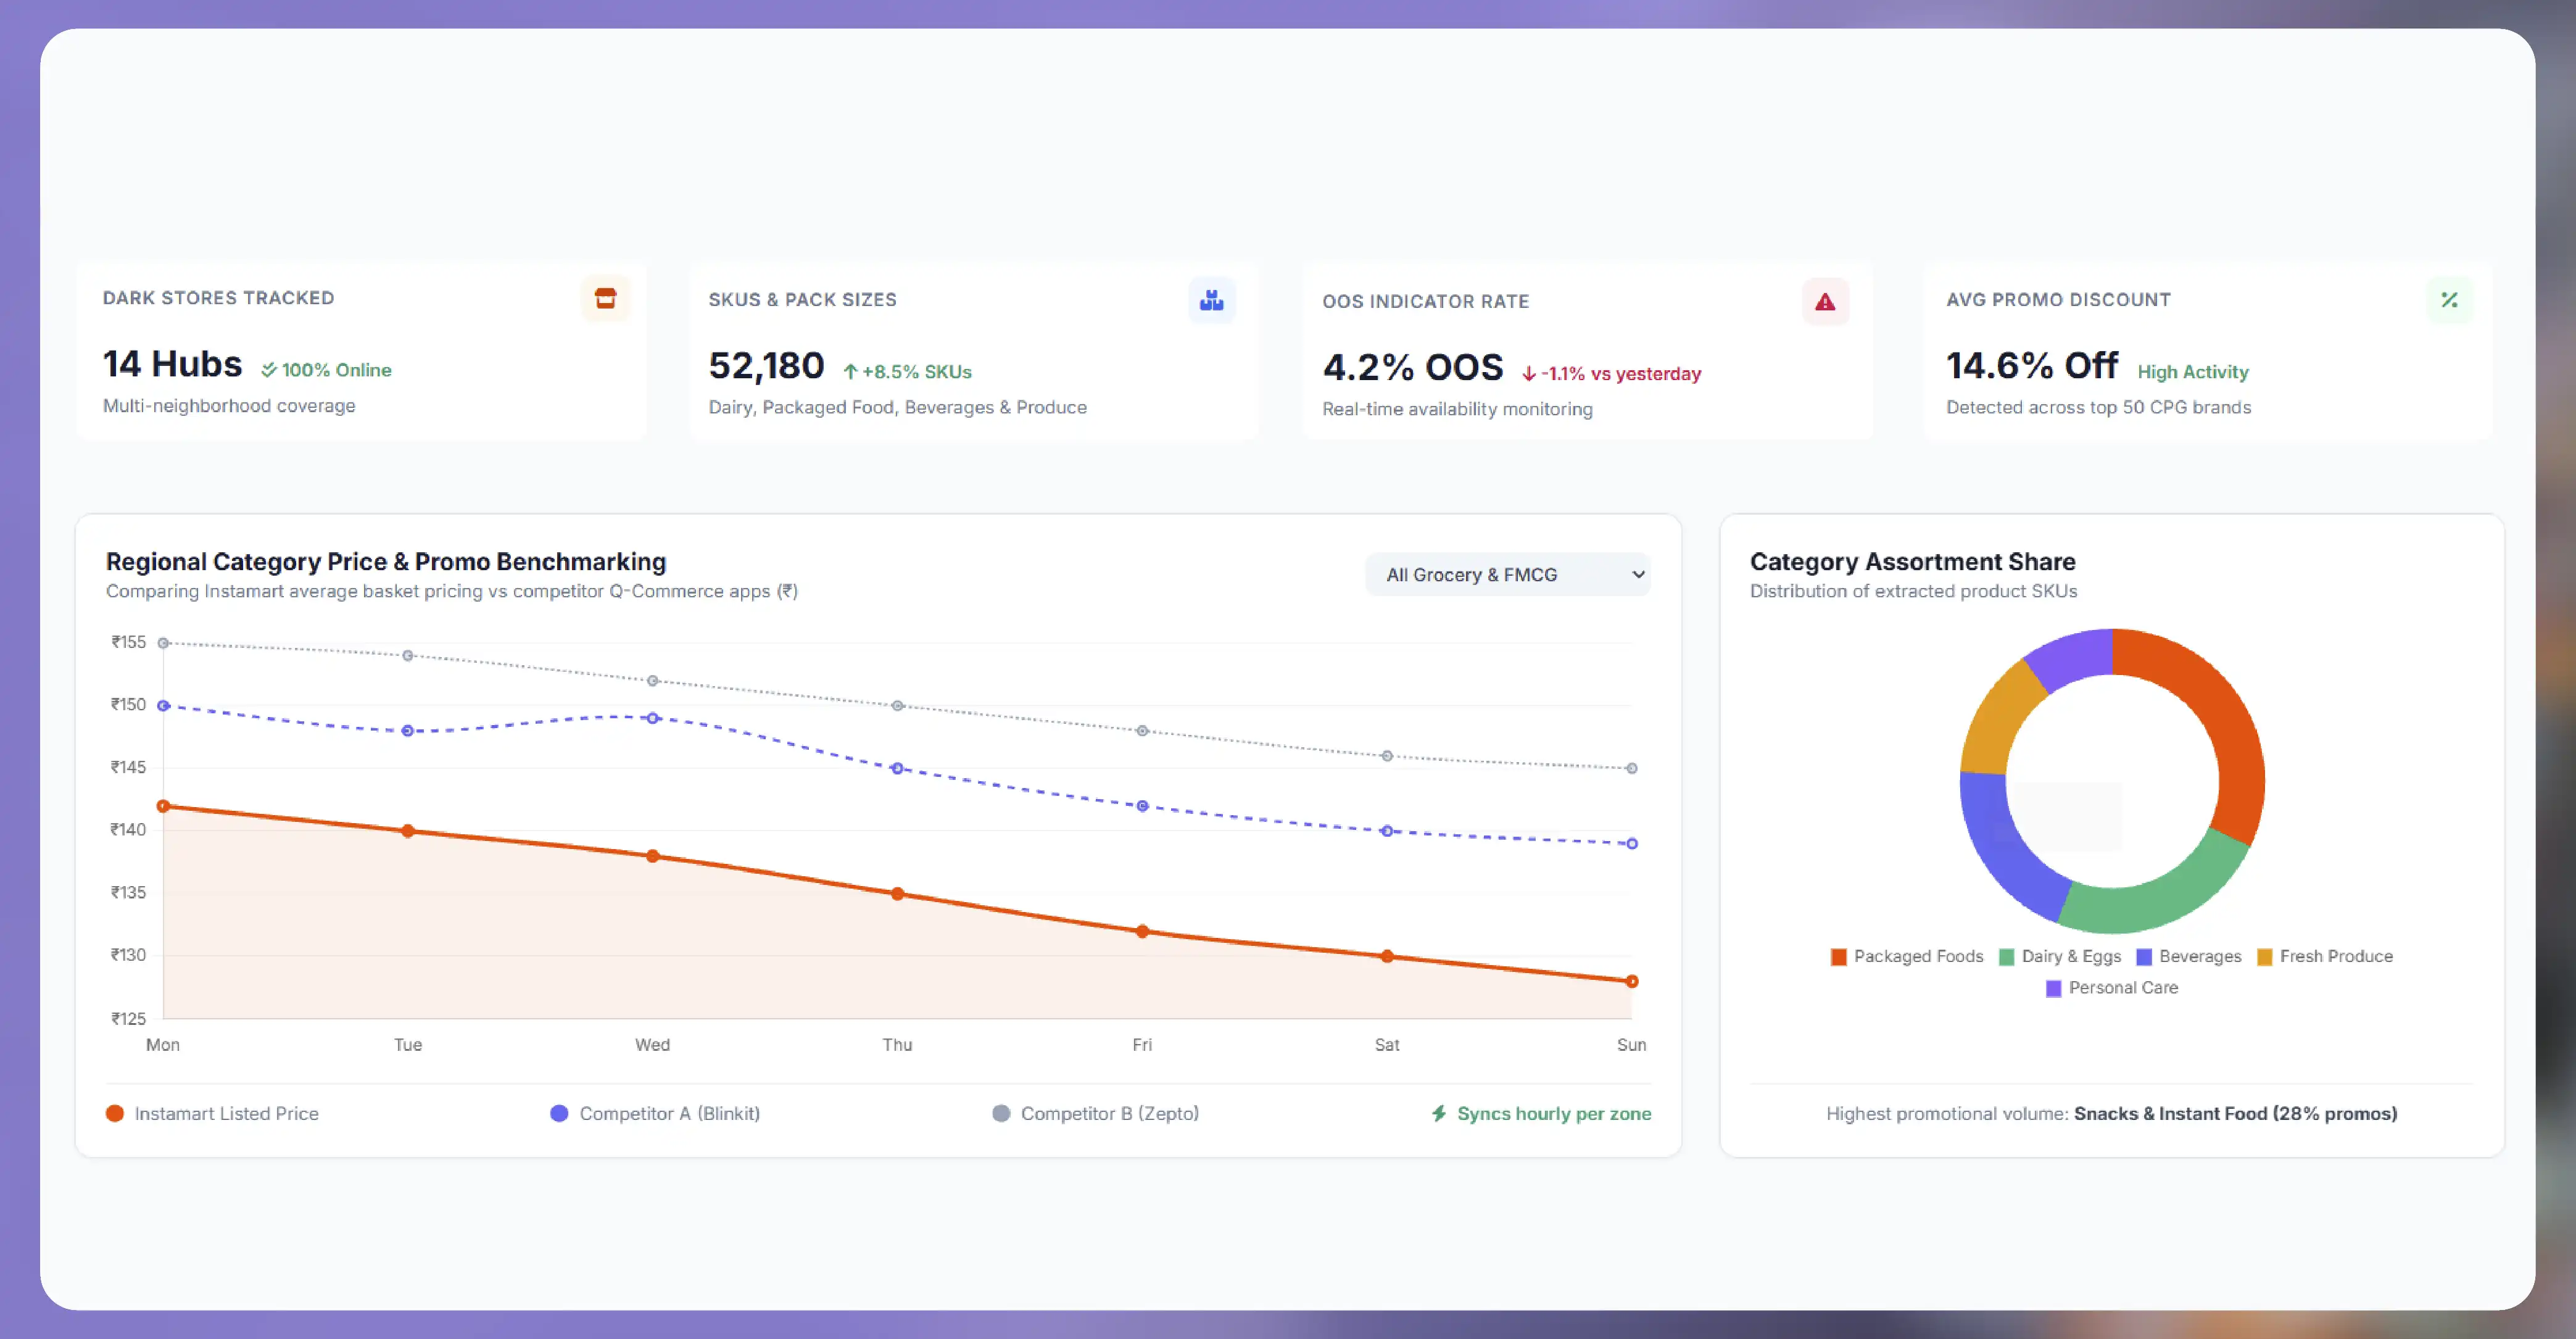
Businesses seeking to Extract Instamart data API information can design collection workflows around relevant product categories, supported locations, and specific business objectives. Depending on authorized access and source availability, the resulting dataset may include product titles, brand names, quantities, prices, offers, and stock indicators.
For example, a packaged-food manufacturer may want to monitor the prices of its products across selected neighborhoods. A structured Instamart dataset can help identify differences in promotional activity, pack-size positioning, and product availability. Retail analysts can also investigate whether particular categories consistently feature discounts or whether assortment varies between serviceable areas.
Key Use Cases for Instamart Data
1. Price monitoring: Businesses can compare listed prices across selected products and track changes over time, helping pricing teams evaluate their market positioning.
2. Product availability analysis: Stock indicators, when available and sufficiently reliable, can help identify potential assortment gaps and recurring availability changes.
3. Promotional tracking: Historical observations can reveal how frequently products appear in promotional campaigns and how displayed discounts change across collection periods.
4. Assortment planning: Category-level information can help manufacturers assess product representation, pack-size coverage, and the presence of competing brands.
5. Regional comparisons: Location-specific observations can reveal differences in product selection and displayed prices across supported service areas.
These applications work best when records include timestamps, consistent product identifiers, and clear location definitions.
Understanding the Zepto API
Zepto competes in a market where speed, assortment, and convenience influence customer purchasing decisions. Its digital product listings can provide useful market signals for businesses seeking to understand product visibility and category competition.
A structured Scrape quick commerce product data API workflow can help organizations capture permitted product information, standardize product attributes, and make observations available to analytics platforms. Rather than treating every product page as an isolated record, the workflow can connect products to brands, categories, pack sizes, and collection locations.
How Zepto Data Extraction Supports Business Decisions?
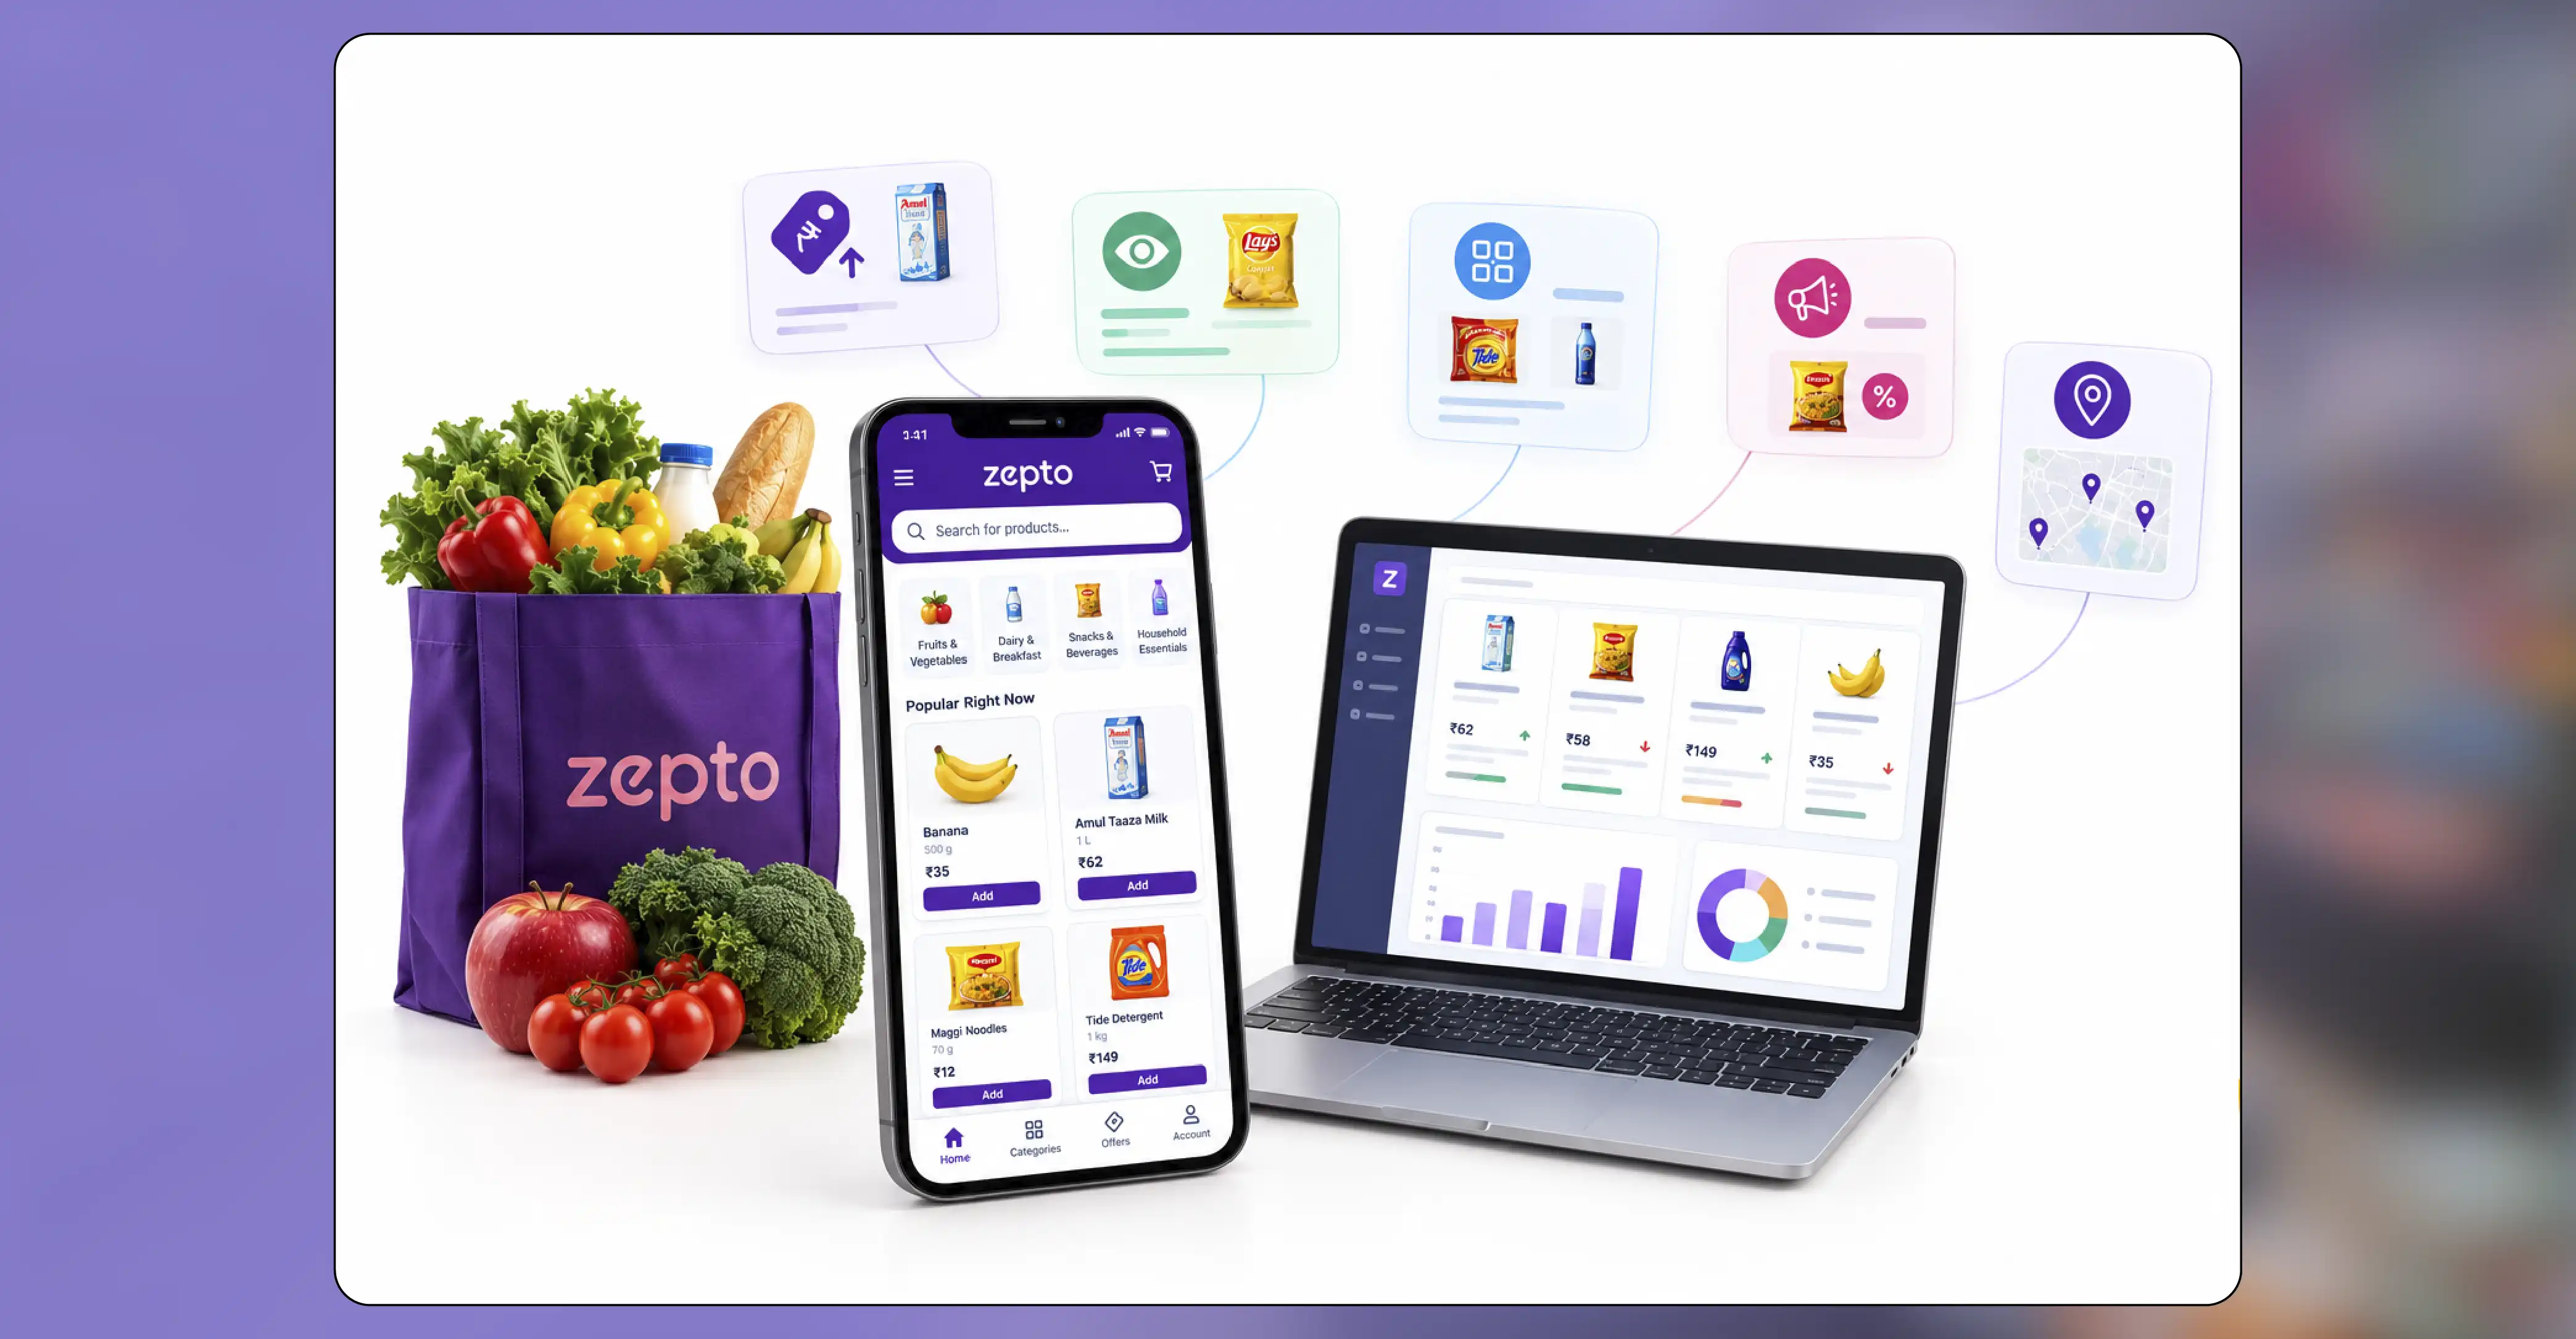
- Competitive pricing intelligence: Retailers can compare equivalent products and pack sizes to understand differences in displayed prices and promotional positioning.
- Brand visibility analysis: Manufacturers can evaluate whether their products appear in relevant categories and compare their representation with competing brands.
- Category performance research: Analysts can study the distribution of products across categories, identifying areas with broad selection or limited assortment.
- Promotion effectiveness: Repeated observations can help businesses distinguish short-lived discounts from more persistent promotional patterns.
- Market expansion planning: Brands can use location-specific observations to identify potential opportunities for expanding distribution or improving digital shelf coverage.
Organizations requiring specialized collection and processing can consider Zepto Data Scraping Services to build workflows around their required categories, locations, data fields, and update schedules.
Reliable analysis requires more than collecting large volumes of information. Product names may differ between listings, pack sizes may be presented inconsistently, and promotions may change before the next collection cycle. Data normalization, duplicate detection, and timestamp validation are therefore essential.
Understanding the Blinkit API
Blinkit provides another important source of quick commerce market observations. Its product listings can help brands and retailers investigate digital shelf conditions, including pricing, assortment, promotional activity, and availability.
A well-designed Quick commerce analytics API can transform collected information into structured metrics that support business dashboards, reporting systems, and analytical applications. Instead of reviewing individual listings manually, decision-makers can monitor changes across selected products and categories through a unified interface.
Practical Applications of Blinkit Data
- Price and discount tracking: Historical product observations can help analysts monitor listed prices and advertised promotions.
- Digital shelf monitoring: Brands can investigate product presence, title consistency, pack-size representation, and other visible listing attributes.
- Availability assessment: Collected stock indicators can support the identification of potential availability gaps, provided their limitations are clearly understood.
- Competitor benchmarking: Product-level comparisons can help businesses assess differences in pricing, assortment, and promotional positioning.
- Regional market intelligence: Where data collection is permitted and location-specific information is available, businesses can compare selected service areas to understand market variation.
Implementing Blinkit data scraping workflows requires careful attention to source accessibility, collection frequency, data quality, and applicable platform rules. Businesses should use authorized access methods, respect technical restrictions, and avoid assuming that information visible in one location represents availability across an entire city.
Why Integrate Instamart, Zepto, and Blinkit Data?
Collecting information from one platform provides a limited view of the market. Integrating observations from multiple platforms allows businesses to compare market conditions more systematically.
A multi-platform pipeline can organize product records around shared attributes, such as brand, product category, quantity, and unit of measurement. This makes comparisons more meaningful and reduces the risk of treating differently sized packages as equivalent products.
1. Cross-Platform Price Benchmarking
A business can compare equivalent products across Instamart, Zepto, and Blinkit. Unit-price calculations, where pack quantities are available, make comparisons more meaningful than comparing displayed prices alone.
2. Promotional Intelligence
Tracking advertised discounts across platforms can help identify where products receive greater promotional visibility. Historical records also support analysis of campaign duration and changing offer patterns.
3. Assortment Comparisons
Brands can investigate whether products are listed consistently across platforms and whether competing products receive broader category representation.
4. Location-Based Insights
Product selection and prices can vary by service area. Comparing properly identified locations helps analysts distinguish genuine geographic differences from changes caused by collection timing or availability.
5. Better Demand Planning
Price and availability observations can complement internal sales, inventory, and demand-planning data. However, product visibility alone does not establish actual sales or consumer demand. Businesses should combine external observations with reliable first-party information.
Building an Effective Quick Commerce Data Pipeline
A useful data pipeline begins with a clear business objective. Organizations should define which products, categories, locations, and attributes they need before choosing a collection method.
The process generally involves five stages.
- Source selection: Identify authorized APIs, licensed providers, or permitted data collection methods appropriate for each platform.
- Data collection: Retrieve available product information at a frequency aligned with the business requirement and the source's permitted access conditions.
- Data cleaning: Standardize product names, quantities, units, currencies, category labels, and other comparable attributes. Remove duplicates and flag incomplete records.
- Data validation: Check timestamps, missing values, unexpected price changes, and inconsistent product identifiers. Distinguish confirmed observations from inferred values.
- Analytics and delivery: Publish validated records to dashboards, databases, business intelligence tools, or internal applications through appropriate interfaces.
Automation should also include monitoring for failed requests, changes in source structure, and incomplete collection runs. These controls help maintain dependable datasets as platforms and product catalogs evolve.
Essential Metrics for Quick Commerce Intelligence
A strong analytics framework focuses on metrics that support specific business decisions.
Price change percentage measures how a product's observed price changes between comparable collection periods. Discount frequency tracks how often an item appears with a promotional label. Availability coverage measures the share of monitored product-location observations with an available status.
Assortment coverage evaluates how many relevant products are represented in a category or location. Product attribute completeness measures the proportion of records containing required fields, such as brand, quantity, and category.
A digital shelf visibility metric can also be developed using defined rules for product presence, listing position, or attribute completeness. The methodology should be documented because visibility measures vary according to the data available.
For a Swiggy Instamart data scraping project, these indicators can help organizations investigate product coverage, price variation, and promotional patterns across selected markets. The same analytical framework can be adapted for other supported platforms, provided differences in available fields and collection methods are considered.
Data Quality, Compliance, and Operational Challenges
Quick commerce data can change rapidly, making data quality a central concern. Product listings may disappear, stock indicators may become outdated, and displayed prices may differ by location. Automated systems must therefore record when each observation was collected and avoid presenting historical information as live data.
Product matching presents another challenge. Two listings may use different titles for the same item, while similar titles may describe different quantities or variants. Matching systems should consider brand, product identifiers, pack size, and other available attributes before treating records as equivalent.
Organizations should also verify the legal and contractual basis for collecting and using platform information. They should follow applicable terms, privacy requirements, access controls, and rate limits. Official APIs or licensed providers are preferable wherever suitable access is available.
Finally, businesses should distinguish correlation from causation. A price reduction coinciding with improved availability does not necessarily mean the discount caused the change. Combining market observations with sales records and carefully designed analysis produces more credible conclusions.
How iWeb Data Scraping Can Help You?
1. Customized Data Collection
iWeb Data Scraping can help businesses structure relevant product, price, promotion, and availability information around defined categories, locations, and reporting requirements.
2. Cross-Platform Benchmarking
Standardized records support comparable analysis across Instamart, Zepto, and Blinkit, helping teams evaluate product positioning and competitive pricing patterns.
3. Data Cleaning and Validation
Structured processing can reduce duplicate records, standardize product attributes, identify missing fields, and flag unusual values before information enters reporting systems.
4. Flexible Data Delivery
Validated datasets can be prepared in suitable formats for dashboards, spreadsheets, databases, or analytics applications, depending on project requirements and integration capabilities.
5. Ongoing Market Monitoring
Scheduled collection and quality checks can support recurring reports, helping businesses identify changes in observed prices, promotional activity, assortment, and product availability over time.
Conclusion
Quick commerce data intelligence enables businesses to understand fast-changing digital retail conditions with greater consistency and precision. By collecting and analyzing relevant product listings, prices, promotions, and availability indicators, organizations can make better-informed decisions about pricing, assortment, competition, and market coverage.
A well-designed API-based workflow can bring Instamart, Zepto, and Blinkit observations into a unified analytical environment, provided the underlying access methods are authorized and the collected records are validated.
Implementing Quick-commerce data scraping with appropriate quality controls helps businesses transform fragmented market observations into structured, usable information. Well-maintained Quick-commerce datasets can support recurring comparisons, historical analysis, and more informed operational planning.
Ultimately, Quick Commerce Analytics helps brands, retailers, and researchers move from occasional manual checks toward repeatable, evidence-based market intelligence. The greatest value comes from combining reliable data collection with clear metrics, sound interpretation, and business decisions grounded in verified information.
