India Flight + Hotel Data Pricing Benchmark Report 2026
Author : Travel Scrape | Published On : 06 Oct 2026
Introduction
India's travel-pricing environment in 2026 is increasingly shaped by dynamic airfare, fluctuating hotel room rates, changing inventory, promotional discounts, and differences between direct and third-party booking channels. This makes structured pricing intelligence important for OTAs, travel agencies, metasearch platforms, corporate travel companies, revenue managers, and market researchers.
The India Flight + Hotel Data Pricing Benchmark Report 2026 examines how flight and accommodation pricing data can be structured, refreshed, compared, and benchmarked across India's major travel markets. The benchmark combines illustrative dataset metrics with current industry indicators to demonstrate the type of intelligence that a continuously collected travel dataset can deliver.
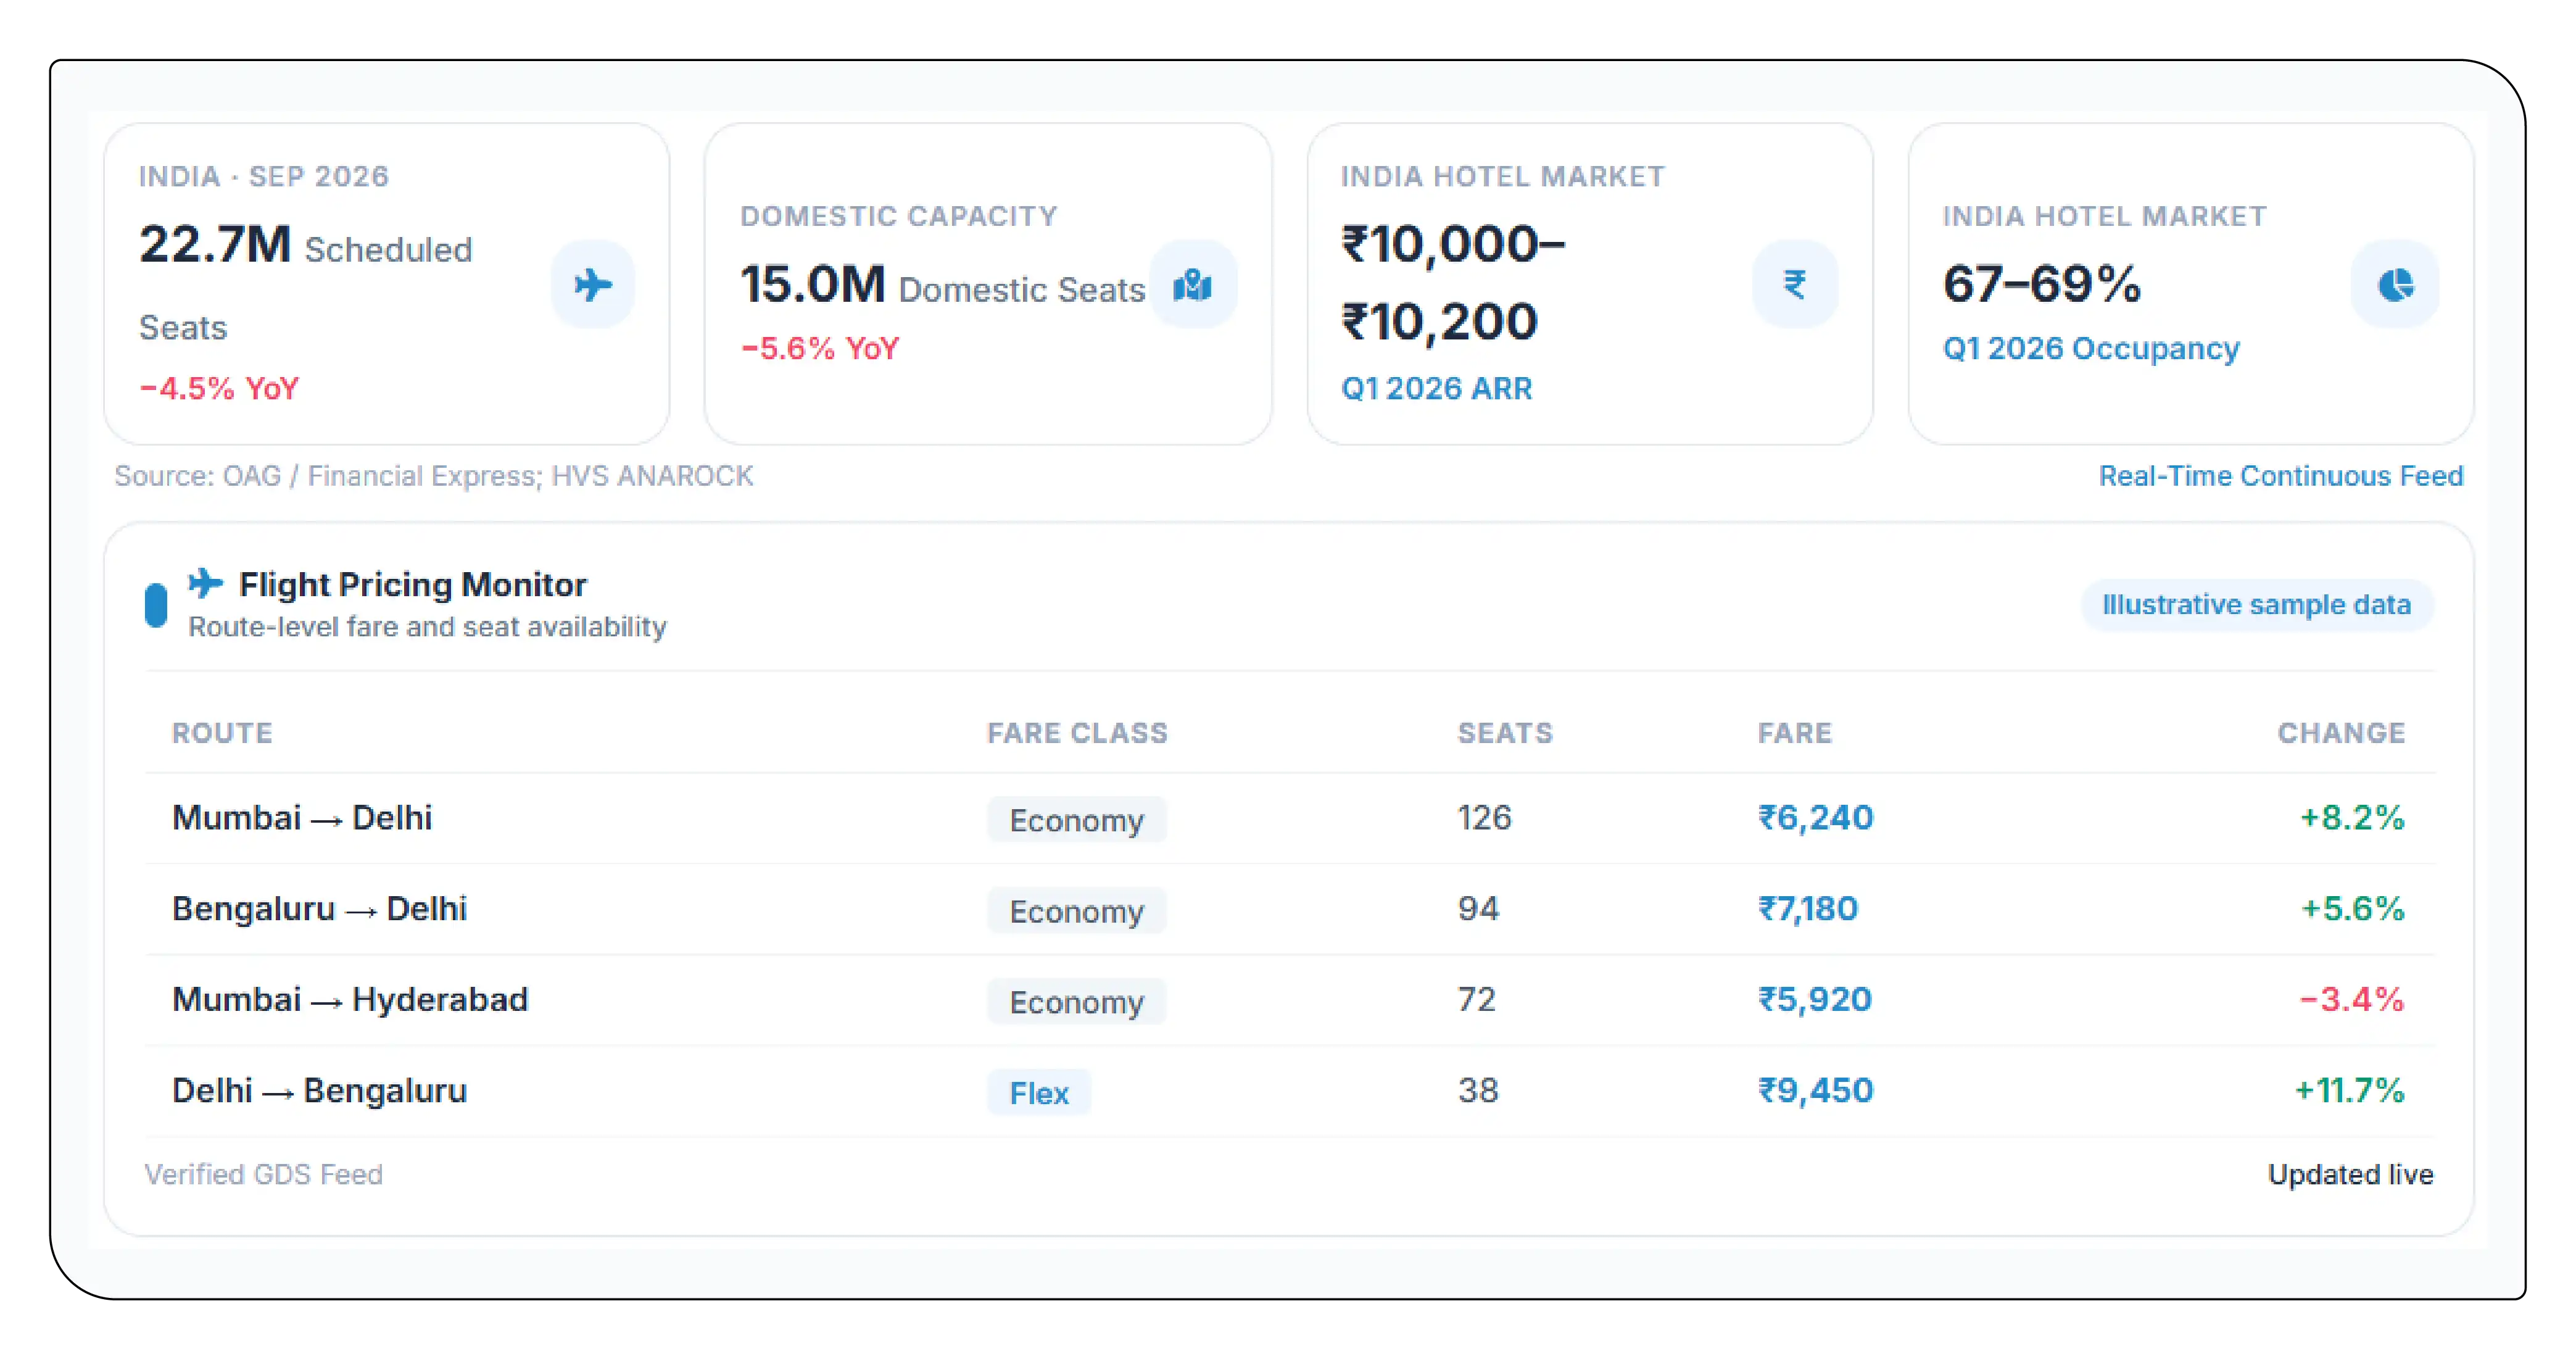
India's aviation market experienced considerable movement during 2026. ICRA estimated domestic passenger traffic at 137.2 lakh in June 2026, up only 0.9% year over year, while domestic capacity declined 5.5%. Load factor consequently reached an estimated 90.2%.
At the same time, hotel performance remained comparatively resilient. HVS ANAROCK reported Q1 2026 nationwide hotel ARR of approximately ₹10,000–₹10,200, occupancy of 67–69%, and RevPAR of ₹6,700–₹7,038.
These conditions create a valuable environment for benchmarking the relationship between transportation costs, accommodation costs, destination demand, booking windows, and seasonal pricing.
Market Context: Why Flight and Hotel Pricing Need Continuous Benchmarking
Flight prices can change multiple times during a single day depending on inventory, departure date, demand, route competition, fare class, and remaining seats. Hotel rates behave similarly, changing according to occupancy, room type, cancellation conditions, events, weekends, holidays, and booking lead time.
In September 2026, Indian airlines were adjusting capacity selectively. OAG data reported by Financial Express indicated scheduled capacity from India was expected to decline 4.5% year over year to 22.7 million seats in September, with domestic capacity down 5.6%.
This makes Airline Data Scraping valuable for monitoring route-level fares, seat availability, airline schedules, fare families, baggage inclusions, and changes in displayed prices.
Businesses can Scrape flight and hotel pricing data in India to create standardized datasets covering departure city, destination, travel date, property, room type, airline, fare class, taxes, discounts, and final payable price.
The hotel side is also highly dynamic. HVS ANAROCK reported healthy ADR growth across key Indian hotel markets during May 2026, supported by domestic travel, corporate movement, and MICE activity.
Benchmark Methodology
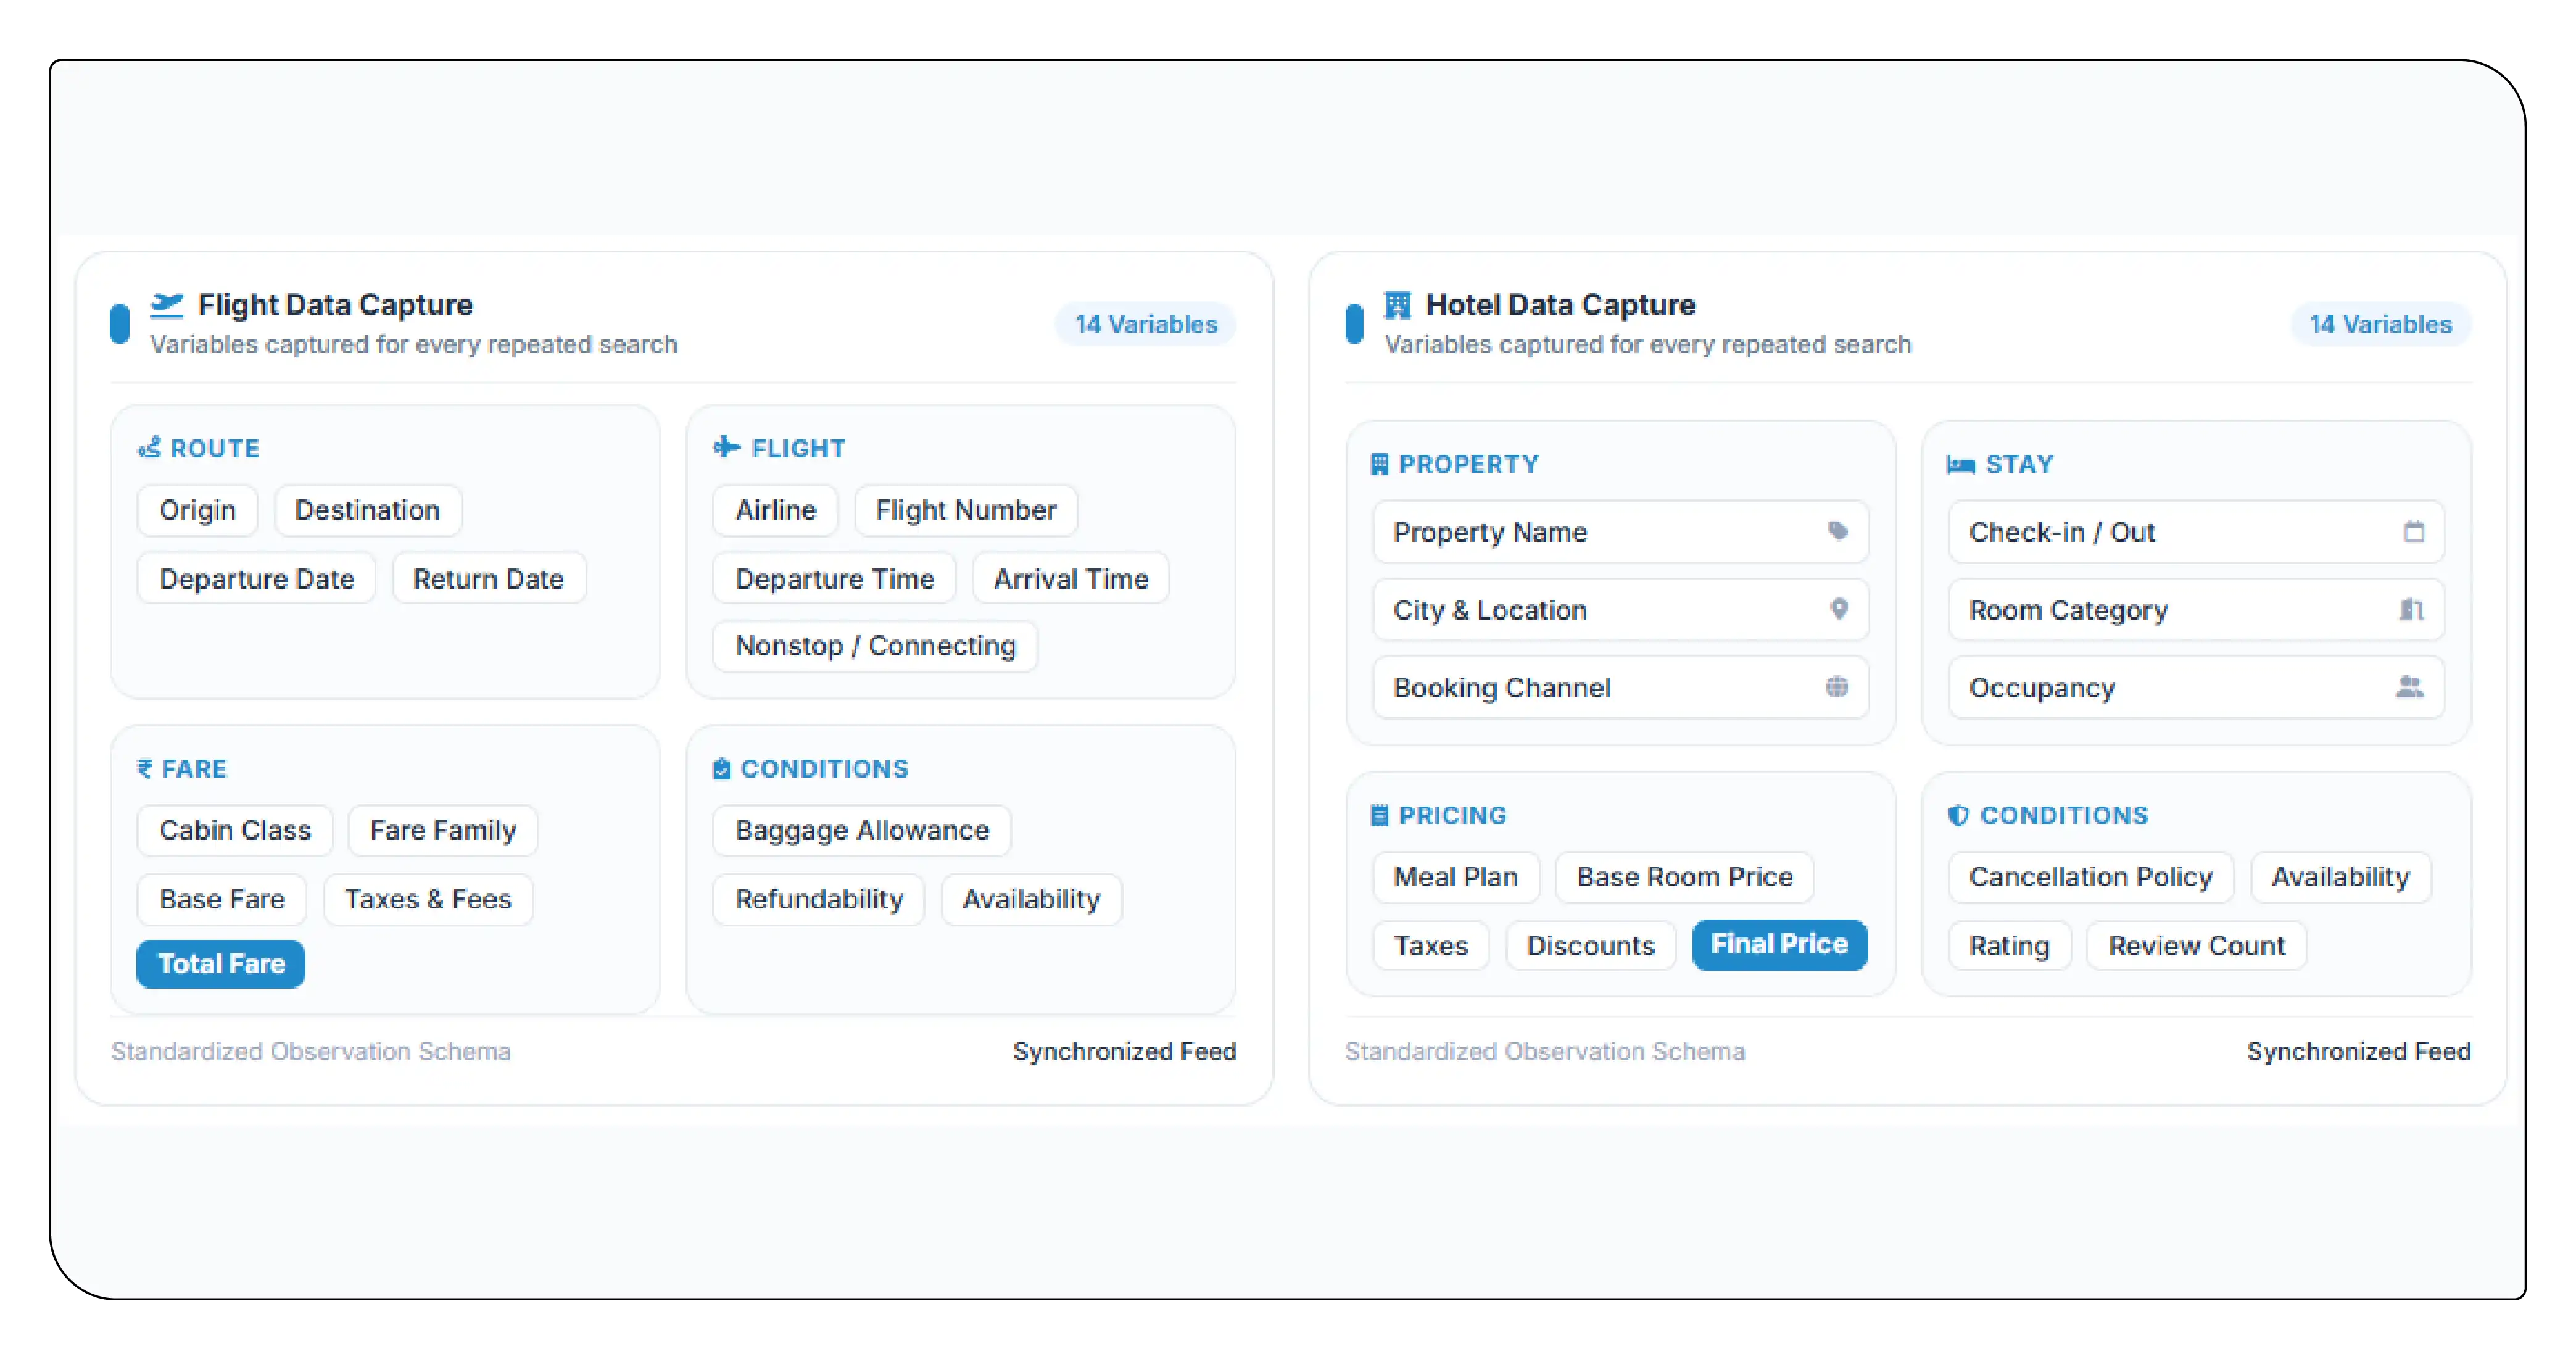
A comprehensive flight-plus-hotel benchmark should capture the same search parameters repeatedly rather than relying on one-time observations.
For flights, important variables include:
- Origin and destination
- Departure and return dates
- Airline
- Flight number
- Departure and arrival time
- Nonstop/connecting status
- Cabin class
- Fare family
- Base fare
- Taxes and fees
- Baggage allowance
- Refundability
- Total fare
- Availability
For hotels, the dataset should capture:
- Property name
- City and location
- Check-in/check-out
- Room category
- Occupancy
- Meal plan
- Cancellation policy
- Base room price
- Taxes
- Discounts
- Final price
- Availability
- Rating
- Review count
- Booking channel
A standardized methodology allows analysts to calculate price differences between platforms while also measuring the frequency and magnitude of changes.
Flight Pricing Benchmark Across Major Indian Routes
The following benchmark is an illustrative research dataset, designed to demonstrate how a structured 2026 flight-pricing database can be organized. Actual fares vary continuously according to search conditions and inventory.
| Route | Avg Economy Fare ₹ | Avg Fare/KM ₹ | Lowest Observed ₹ | Highest Observed ₹ | Avg Taxes ₹ | Avg Flight Time | Daily Flight Records | Price Volatility % | Typical Lead Time |
|---|---|---|---|---|---|---|---|---|---|
| Delhi–Mumbai | 6,850 | 3.92 | 4,210 | 13,480 | 1,180 | 2h 15m | 1,420 | 28.4 | 18 days |
| Mumbai–Bengaluru | 6,420 | 4.21 | 3,980 | 12,760 | 1,110 | 1h 50m | 1,260 | 31.7 | 17 days |
| Delhi–Bengaluru | 7,380 | 3.64 | 4,650 | 15,900 | 1,240 | 2h 45m | 1,050 | 34.2 | 21 days |
| Mumbai–Delhi | 6,920 | 3.95 | 4,180 | 13,850 | 1,190 | 2h 10m | 1,430 | 29.1 | 18 days |
| Delhi–Hyderabad | 6,180 | 3.72 | 3,860 | 12,400 | 1,060 | 2h 15m | 920 | 27.8 | 19 days |
| Bengaluru–Hyderabad | 4,420 | 4.58 | 2,950 | 8,850 | 820 | 1h 15m | 850 | 24.6 | 15 days |
| Mumbai–Goa | 5,240 | 5.48 | 3,120 | 10,700 | 920 | 1h 15m | 690 | 35.1 | 20 days |
| Delhi–Kolkata | 7,250 | 3.89 | 4,520 | 14,680 | 1,210 | 2h 20m | 780 | 30.8 | 20 days |
| Chennai–Delhi | 7,620 | 3.51 | 4,780 | 15,250 | 1,280 | 2h 50m | 620 | 32.5 | 22 days |
| Pune–Delhi | 6,740 | 4.16 | 4,150 | 13,920 | 1,160 | 2h 10m | 590 | 33.7 | 18 days |
| Kolkata–Mumbai | 7,180 | 3.87 | 4,490 | 14,420 | 1,220 | 2h 40m | 650 | 29.8 | 21 days |
| Ahmedabad–Mumbai | 4,280 | 5.12 | 2,850 | 8,620 | 790 | 1h 10m | 530 | 25.4 | 14 days |
The benchmark illustrates why average fare alone is insufficient. A route with a ₹6,500 average fare can still experience substantially different minimum, maximum, tax, and volatility characteristics.
This is where Flight Price Data Intelligence becomes useful: instead of monitoring a single displayed price, organizations can analyze thousands of observations to identify route-level pricing patterns.
Hotel Pricing Benchmark Across Indian Markets
Hotel pricing requires an equally granular approach because two rooms in the same property can have different prices depending on room category, meal plan, cancellation policy, occupancy, and booking date.
The following is an illustrative benchmark dataset.
| City | Hotel Segment | Avg Room Rate ₹ | Lowest Rate ₹ | Highest Rate ₹ | Avg Tax ₹ | Occupancy % | Avg Discount % | Daily Records | Rate Volatility % | Avg Lead Time |
|---|---|---|---|---|---|---|---|---|---|---|
| Mumbai | Luxury | 18,900 | 13,200 | 31,800 | 3,402 | 78 | 11.8 | 4,820 | 27.6 | 16 days |
| Delhi | Luxury | 17,450 | 11,900 | 29,600 | 3,141 | 80 | 13.4 | 4,560 | 29.1 | 15 days |
| Bengaluru | Luxury | 15,850 | 10,700 | 27,400 | 2,853 | 76 | 14.2 | 4,280 | 25.8 | 14 days |
| Goa | Luxury | 21,600 | 14,800 | 39,500 | 3,888 | 82 | 9.7 | 3,940 | 38.4 | 24 days |
| Hyderabad | Luxury | 13,900 | 9,200 | 23,800 | 2,502 | 72 | 15.6 | 3,760 | 24.9 | 13 days |
| Chennai | Luxury | 13,650 | 9,050 | 22,700 | 2,457 | 70 | 16.1 | 3,420 | 23.7 | 12 days |
| Jaipur | Luxury | 14,850 | 9,600 | 28,900 | 2,673 | 75 | 12.9 | 3,180 | 31.5 | 20 days |
| Kochi | Luxury | 12,950 | 8,400 | 25,600 | 2,331 | 73 | 13.8 | 2,960 | 29.7 | 18 days |
| Pune | Upper Upscale | 10,850 | 7,200 | 18,900 | 1,953 | 69 | 17.4 | 2,740 | 21.6 | 11 days |
| Ahmedabad | Upper Upscale | 9,950 | 6,700 | 17,500 | 1,791 | 67 | 18.2 | 2,410 | 20.8 | 10 days |
| Udaipur | Luxury | 18,250 | 11,900 | 36,700 | 3,285 | 79 | 10.4 | 2,250 | 40.2 | 27 days |
| Kolkata | Upper Upscale | 10,650 | 7,100 | 18,400 | 1,917 | 68 | 16.7 | 2,520 | 22.9 | 13 days |
The city differences demonstrate the importance of combining price with occupancy, discounts, booking lead time, and inventory. Goa and Udaipur, for example, can exhibit stronger event- and season-related rate movements than several corporate-heavy markets.
Current market reporting supports the importance of these variables. In Q1 2026, HVS ANAROCK recorded 67–69% national hotel occupancy and ₹10,000–₹10,200 ARR.
Flight and Hotel Dataset Vendor Comparison
An India Flight Hotel Data Vendor Comparison dataset can help companies compare providers on parameters beyond headline pricing.
Typical evaluation fields include:
| Vendor Category | Flight Coverage | Hotel Coverage | Refresh Interval | Historical Data | API Availability | Geographic Coverage | Data Format | Approx. Records/Month | SLA Target |
|---|---|---|---|---|---|---|---|---|---|
| OTA Data Provider | High | High | 15–60 min | Yes | Yes | India + Global | JSON/CSV | 8.5M | 99.0% |
| Travel API Provider | High | Medium–High | Near real time | Limited | Yes | Global | JSON | 11.2M | 99.5% |
| Web Data Vendor | High | High | 1–6 hr | Yes | Optional | India-focused | CSV/JSON | 6.8M | 97.0% |
| Enterprise Travel Dataset | Medium | High | 6–24 hr | Yes | Yes | Multi-country | CSV/Parquet | 4.1M | 98.5% |
| Custom Scraping Provider | Custom | Custom | Client-defined | Yes | Yes | Client-defined | JSON/CSV/API | 12.7M | 99.0% |
These figures are benchmark-model examples rather than published commercial quotations. Actual vendor pricing and coverage depend on source scope, request volume, geography, historical depth, infrastructure, and contractual requirements.
Benchmarking Data Refresh Rates
India Flight Hotel Data Refresh Rate Benchmarking is particularly important because stale travel prices can make an otherwise large dataset commercially ineffective.
For high-frequency flight markets, a 15–30-minute collection cycle can provide substantially more observations than daily collection. Hotel pricing may also require frequent refreshes during weekends, holidays, conferences, festivals, and high-demand periods.
A practical framework can classify refresh requirements as:
- Real-time: seconds to minutes
- Near real-time: 15–60 minutes
- Frequent: 1–4 hours
- Daily: once or twice per day
- Historical: scheduled archival collection
The correct frequency depends on the business use case. Revenue-management applications typically require much more frequent collection than long-term market research.
API-Based Travel Pricing Intelligence
A flight and hotel pricing API 2026 can transform raw collection into structured feeds for pricing dashboards, travel applications, revenue-management systems, and internal analytics platforms.
A useful API architecture can expose:
/flights
/hotels
/prices
/availability
/historical-prices
/price-changes
/competitor-rates
/route-benchmarks
For hotels, Hotel Data Scraping can capture room-level information that standard summary datasets frequently omit, including refundable/non-refundable rates, breakfast inclusion, room occupancy, taxes, cancellation deadlines, and promotional codes.
A Real-Time Hotel Data Scraping API can then normalize this information into consistent JSON records and deliver updated observations to business systems.
Measuring Data Record Volume and Commercial Scale
India Flight Hotel Data Record Volume Pricing should be evaluated alongside freshness, accuracy, coverage, and field depth.
For example, collecting 10 million records monthly is not automatically more useful than collecting 3 million records if the larger dataset contains duplicates, stale prices, missing availability, or inconsistent tax treatment.
A robust pricing benchmark therefore measures:
- Number of unique flight observations
- Number of hotel-room observations
- Unique routes
- Unique properties
- Price-change events
- Availability-change events
- Duplicate rate
- Timestamp completeness
- Historical retention
- API response latency
This creates a more meaningful measurement of data quality than raw record count.
Business Applications
The resulting benchmark can support several travel-industry use cases.
OTA Competitive Monitoring
OTAs can compare their displayed rates with competing channels, identify price gaps, and monitor changes throughout the booking lifecycle.
Revenue Management
Hotels can combine historical room rates with occupancy, booking windows, events, and competitor pricing to support rate-management workflows.
Corporate Travel Analytics
Travel managers can track average route costs, hotel spending, city-level inflation, and policy compliance.
Travel Market Research
Analysts can examine destination-level pricing trends and compare transportation and accommodation costs across Indian cities.
Dynamic Pricing Analysis
Historical snapshots allow businesses to identify how prices respond to demand, inventory, seasonality, and booking lead time.
Key Findings
The benchmark highlights several structural characteristics of India's travel-pricing environment in 2026.
First, airfare remains highly dynamic. Current aviation data shows airlines adjusting capacity in response to demand and operating conditions.
Second, hotel pricing continues to demonstrate meaningful city-level variation. HVS ANAROCK's 2026 data shows that occupancy and ARR remain important indicators for understanding hotel-market performance.
Third, price data without timestamps has limited analytical value. Every observation should ideally retain collection time, travel date, inventory state, tax information, and booking conditions.
Finally, combining flight and hotel data creates a broader travel-cost intelligence layer. Instead of studying airfare and accommodation independently, analysts can calculate total trip costs, destination affordability, route-hotel correlations, and seasonal travel-price movements.
Conclusion
The India travel market in 2026 demonstrates why continuously refreshed pricing datasets are becoming important for travel analytics. Domestic aviation capacity and demand have experienced meaningful changes, while hotel markets continue to show city-level differences in occupancy and room-rate performance.
A structured flight-and-hotel dataset can connect airfare, accommodation rates, availability, discounts, taxes, booking windows, and historical observations within one analytical framework. Real-Time Price Intelligence can consequently support competitive benchmarking, revenue analysis, travel-budget planning, market research, and pricing-monitoring applications.
The strongest datasets are not simply the largest. Their value depends on coverage + freshness + consistency + historical depth + field-level accuracy. For organizations operating across India's rapidly changing travel ecosystem, these characteristics determine whether pricing data becomes a basic information feed or a strategic intelligence asset.
Ready to elevate your travel business with cutting-edge data insights? Scrape Aggregated Flight Fares to identify competitive rates and optimize your revenue strategies efficiently. Discover emerging opportunities with tools to Extract Travel Website Data, leveraging comprehensive data to forecast market shifts and enhance your service offerings. Real-Time Travel App Data Scraping Services helps stay ahead of competitors, gaining instant insights into bookings, promotions, and customer behavior across multiple platforms. Get in touch with Travel Scrape today to explore how our end-to-end data solutions can uncover new revenue streams, enhance your offerings, and strengthen your competitive edge in the travel market.
Source: https://www.travelscrape.com/india-flight-hotel-data-pricing-benchmark-report.php
Original: https://www.travelscrape.com
