How Analytics Dashboards Help Businesses Understand Clicks, Traffic, and User Behavior
Author : Linkkit . | Published On : 10 Apr 2026
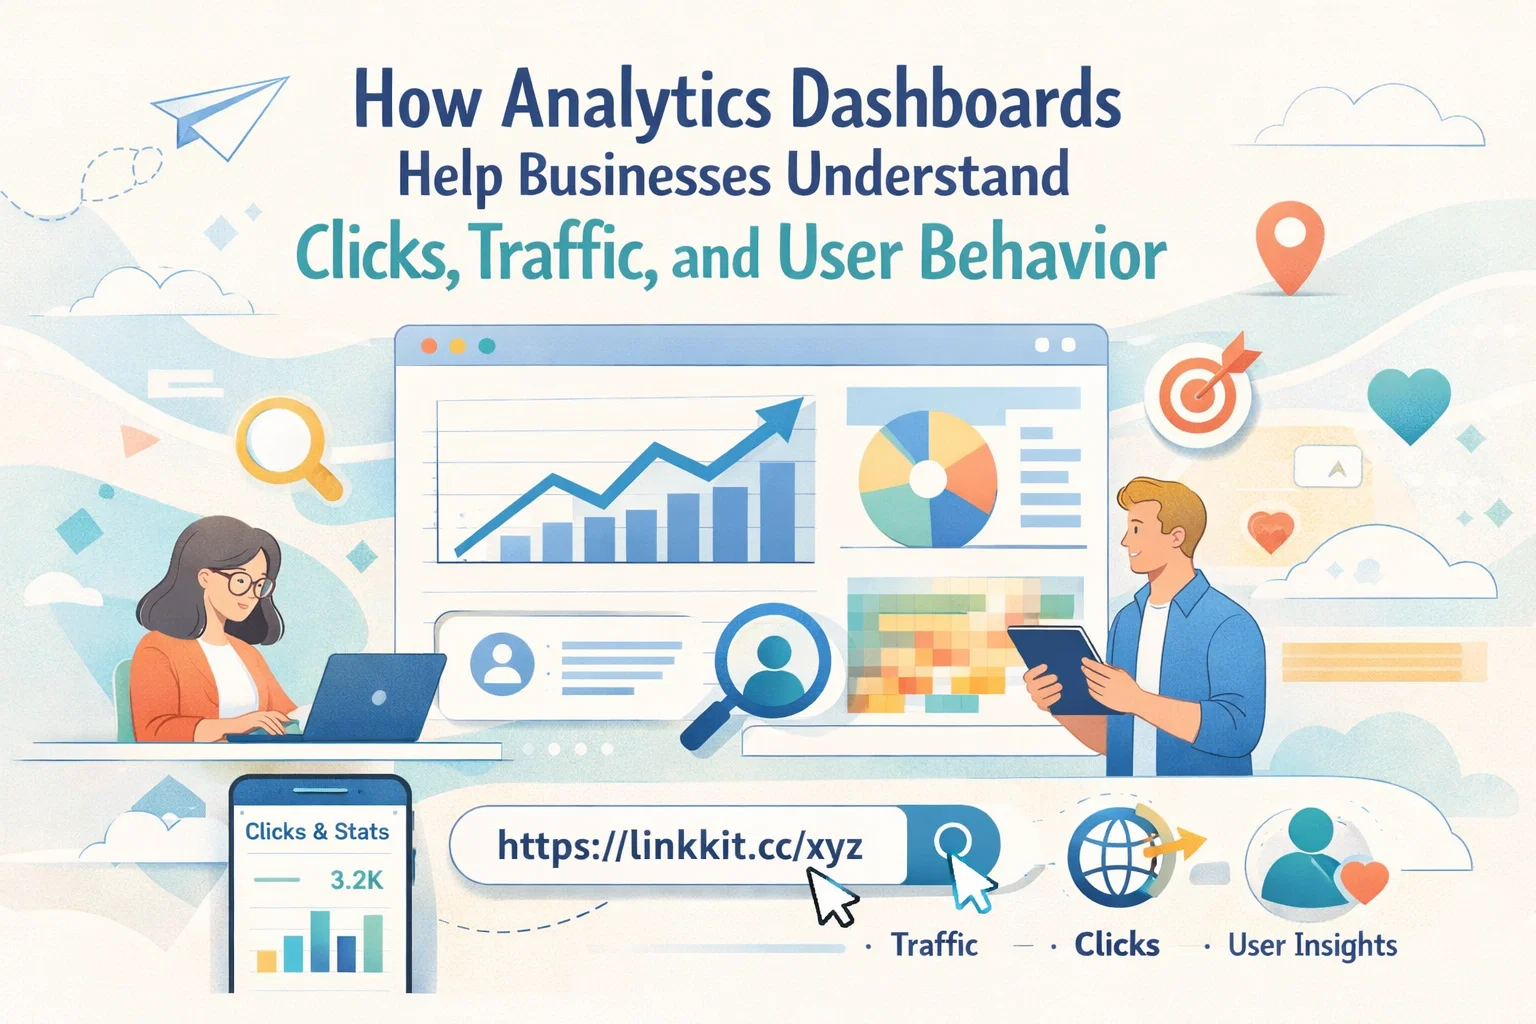
Introduction
In today’s digital environment, every click, scan, and visit carries valuable information. Businesses that understand how users interact with their links, campaigns, and content are better positioned to improve performance and make smarter decisions. This is where analytics dashboards play a critical role.
An analytics dashboard brings together complex data into simple visual reports, allowing teams to monitor activity, identify trends, and measure outcomes without needing advanced technical knowledge. Whether used by marketers, startups, or established companies, these dashboards are becoming essential tools for understanding digital engagement.
Why Analytics Dashboards Matter in Modern Marketing
Marketing campaigns today run across multiple platforms, including social media, email, websites, and offline QR code campaigns. Without proper tracking, it becomes difficult to know which channels are working and which ones need improvement.
Analytics dashboards provide a centralized view of performance data. Instead of manually checking separate tools, users can monitor traffic sources, clicks, and engagement levels in one place.
Some of the key benefits include:
- Faster access to real-time performance data
- Improved decision-making based on accurate insights
- Better campaign tracking and measurement
- Increased visibility into user behavior
By transforming raw data into clear visuals such as charts and filters, dashboards allow businesses to quickly understand what is happening across their campaigns.
Understanding Real-Time Tracking and Event Monitoring
One of the most powerful features of modern analytics tools is real-time tracking. Real-time dashboards display live data as it happens, allowing businesses to monitor ongoing campaigns instantly.
For example, when a marketing link is shared or a QR code is scanned, the dashboard can immediately show:
- The number of clicks or scans
- The location of users
- The device used
- The referral source
This type of immediate feedback helps teams react quickly. If a campaign is performing well, it can be scaled. If performance is low, adjustments can be made before too much time or budget is lost.
Real-time event streams also allow detailed monitoring of user actions such as:
- Link clicks
- Form submissions
- Product page visits
- Conversions or sign-ups
These insights provide a deeper understanding of how users interact with digital assets.
The Importance of Geographic and Device Insights
Not all users behave the same way. Their location, device, and browsing preferences can influence how they interact with digital content.
Analytics dashboards often include geographic and device-specific data that helps businesses understand:
- Which cities or countries generate the most traffic
- Whether users are accessing links from mobile or desktop devices
- Which browsers or operating systems are most common
This information allows businesses to tailor campaigns based on audience behavior.
For example:
- A company targeting mobile users may prioritize mobile-friendly landing pages.
- A campaign receiving high traffic from a specific region may benefit from localized content.
Understanding where users come from and how they access content improves campaign relevance and effectiveness.
How Referrer and UTM Tracking Improve Campaign Visibility
Tracking traffic sources is another important capability of analytics dashboards. Referrer analysis helps identify where visitors are coming from, such as:
- Social media platforms
- Email campaigns
- Websites
- Direct traffic
In addition to referrers, UTM parameters allow marketers to tag specific campaigns with tracking information. This makes it possible to measure:
- Which campaign generated traffic
- Which channel produced the highest engagement
- Which marketing strategy delivered the best results
By combining referrer analysis and UTM tracking, businesses gain a clearer picture of their marketing performance across multiple channels.
Visual Filters Make Complex Data Easier to Understand
Raw data alone can be overwhelming. This is why visual filters are essential in analytics dashboards.
Features such as:
- Bar filters
- Dropdown selectors
- Custom date range pickers
help users narrow down data quickly and compare results across different periods or campaigns.
For instance, a team may want to analyze performance during:
- A product launch week
- A seasonal campaign
- A promotional event
Using filters, users can isolate specific timeframes and identify patterns without manually sorting large datasets.
Link-Level Tracking for Detailed Performance Insights
Not all links perform equally. Some generate high engagement, while others may receive minimal attention.
Link-level tracking allows users to analyze individual links separately. This helps businesses:
- Identify top-performing links
- Optimize underperforming ones
- Compare engagement across campaigns
Detailed insights at the link level also support better testing strategies, such as A/B testing different messages or landing pages.
Many modern platforms, including tools like Linkkit, provide link-level tracking features that help users monitor performance without complex setups. These systems focus on simplifying analytics while still offering meaningful insights.
Exporting Data for Reporting and Collaboration
Data sharing is an important part of decision-making, especially in teams and organizations.
Analytics dashboards often include export features that allow users to download reports in formats such as CSV. This makes it easier to:
- Share results with stakeholders
- Present findings in meetings
- Integrate data into other tools
Exported reports also support long-term analysis by allowing businesses to maintain historical records of performance metrics.
Measuring Customer Insights and Marketing Performance
Beyond clicks and traffic, advanced analytics dashboards help businesses evaluate broader customer metrics such as:
- Customer acquisition cost (CAC)
- Retention rates
- Lifetime value (LTV)
- Conversion rates
These metrics provide insights into how efficiently marketing budgets are being used and how valuable customers are over time.
Understanding customer behavior helps businesses:
- Improve targeting strategies
- Enhance customer experiences
- Increase return on marketing investment
With the right insights, marketing becomes more strategic and less reliant on guesswork.
The Role of QR Code Analytics in Offline Campaigns
QR codes have become widely used in both online and offline campaigns. From product packaging to event banners, QR codes connect physical experiences with digital content.
Analytics dashboards help track QR code performance by showing:
- Number of scans
- Scan location
- Device type
- Time of interaction
These insights allow businesses to measure the effectiveness of offline campaigns just as accurately as digital ones.
Choosing the Right Analytics Dashboard for Your Needs
Selecting an analytics dashboard depends on several factors, including business size, campaign complexity, and reporting needs.
When evaluating tools, consider features such as:
- Real-time tracking capabilities
- Geographic and device insights
- Referrer and UTM support
- Data export options
- Custom filtering tools
- Ease of use and interface design
The ideal dashboard should simplify complex data while providing meaningful insights that support growth.
Final Thoughts
Analytics dashboards have become essential tools for businesses seeking to understand user behavior and improve marketing performance. By combining real-time tracking, geographic insights, visual filters, and detailed reporting, these platforms transform raw data into actionable knowledge.
As digital ecosystems continue to grow, the ability to track clicks, analyze traffic sources, and measure campaign success will remain a key advantage. Many modern platforms, including Linkkit, reflect this shift toward simplified yet powerful analytics systems that help organizations interpret their data more effectively. Businesses that invest in understanding their data are better prepared to adapt, optimize, and succeed in an increasingly competitive landscape.
