Home Depot Data Scraping for Home Improvement & Pro Pricing Intelligence
Author : Fusion data | Published On : 21 Aug 2026
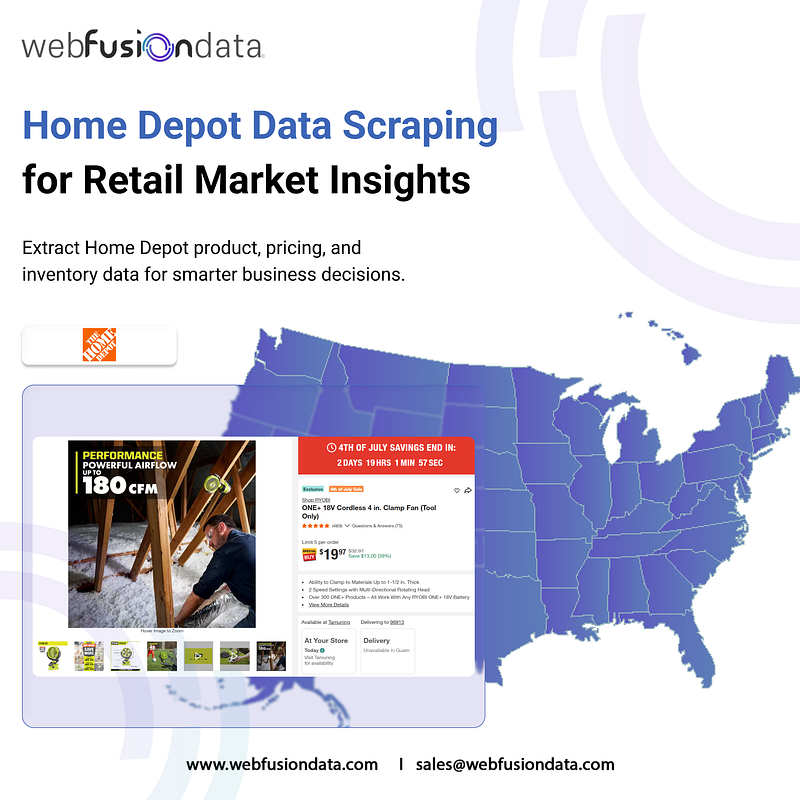
Introduction
Home improvement ecommerce operates differently from conventional retail because purchasing decisions depend on location, project requirements, product specifications, quantity, and availability. A customer replacing a faucet may need one unit, while a contractor working on a renovation project may require dozens of fittings, lumber products, tools, or electrical components. This makes accurate product, pricing, inventory, and fulfillment intelligence essential for retailers, contractors, distributors, and marketplace sellers.
Home Depot Ecommerce Data Scraping can help businesses collect structured information across product categories, prices, specifications, stock indicators, store-level availability, promotions, bulk quantities, and special-order information. Instead of relying only on standard online listings, businesses can build a broader view of how products behave across different purchasing scenarios.
Home improvement shopping also has a strong local component. A product available online may not be available at the nearest store, while another location may have sufficient stock for immediate pickup. Likewise, Pro customers can encounter different pricing structures and quantity requirements compared with DIY shoppers.
By organizing these signals into usable datasets, businesses can improve competitive monitoring, assortment planning, pricing decisions, inventory forecasting, and contractor-focused sales strategies.
Part 1: Solve Local Inventory and Store-Level Availability Challenges
One of the biggest challenges in home improvement ecommerce is understanding whether a product is genuinely available to a customer. Online availability alone can be misleading because inventory may vary significantly between stores. A customer searching for a power tool, plumbing component, appliance, or construction material may prioritize same-day pickup over standard shipping.
Data collection can capture product identifiers, listed prices, availability signals, store information, pickup status, shipping indicators, and stock-related attributes. This enables businesses to compare availability across locations and identify products that frequently move between available and unavailable states.
For example, a retailer monitoring 10,000 SKUs across 50 locations can potentially create 500,000 store-SKU combinations requiring regular observation. The objective is not simply to collect more records; it is to identify meaningful inventory patterns.
- Product SKUs — Example Tracking Level: 10,000+ | Business Value: Assortment monitoring.
- Stores Monitored — Example Tracking Level: 50 | Business Value: Geographic comparison.
- Store-SKU Combinations — Example Tracking Level: 500,000 | Business Value: Inventory visibility.
- Availability Checks — Example Tracking Level: Daily | Business Value: Stock trend detection.
- Pickup Availability — Example Tracking Level: By location | Business Value: Fulfillment planning.
A structured inventory dataset can reveal which products remain consistently available, which frequently become unavailable, and which locations experience recurring shortages. Businesses can use these signals to prioritize replenishment, adjust regional assortment, or identify opportunities where competitors have limited local availability.
Another important advantage is historical tracking. A single availability snapshot only shows the present state. Repeated observations create a timeline that can reveal seasonal demand, regional shortages, promotional spikes, and product replenishment cycles.
For home improvement businesses, this local intelligence can become especially valuable during seasonal periods such as spring renovation, hurricane preparation, winterization, landscaping, and holiday remodeling. Monitoring store-level patterns helps companies make decisions based on actual market conditions rather than relying exclusively on national averages.
Part 2: Solve Pro Pricing, Bulk Purchasing, and Competitive Pricing Problems
Pricing in home improvement is rarely straightforward. DIY shoppers may compare individual-unit prices, whereas contractors often evaluate quantity, project budgets, repeat purchases, and professional pricing structures. Bulk purchasing can therefore create a different competitive landscape from standard retail transactions.
A robust product intelligence program should monitor regular prices alongside quantity information, promotional offers, package sizes, and Pro-oriented pricing signals where available. Comparing products on a unit-equivalent basis is particularly useful because two products may appear similarly priced while offering different quantities.
For example, consider a product priced at $12 per unit versus a five-pack priced at $50. The individual package prices tell only part of the story. The effective unit prices are $12 and $10 respectively, creating a 16.7% difference in unit economics.
- Single-Unit Price — Example: $12 | Why It Matters: DIY comparison.
- Bulk Pack Price — Example: $50 | Why It Matters: Quantity purchasing.
- Pack Quantity — Example: 5 units | Why It Matters: Unit-cost calculation.
- Effective Unit Price — Example: $10 | Why It Matters: Competitive benchmarking.
- Unit-Price Gap — Example: 16.7% | Why It Matters: Pricing opportunity.
Businesses can use these comparisons to identify products where competitors have stronger bulk economics, where promotional pricing creates temporary gaps, or where package sizes distort apparent price comparisons.
Special-order products introduce another layer of complexity. Certain items may not follow the same availability or fulfillment model as regularly stocked merchandise. Capturing special-order indicators, product specifications, lead-time information where displayed, and ordering requirements helps businesses distinguish immediately purchasable products from project-dependent products.
This intelligence can support dynamic pricing reviews, contractor-focused assortment strategies, supplier negotiations, and promotional planning. Instead of asking only, “What is the listed price?”, businesses can ask, “What is the effective price for this purchasing scenario?”
That shift creates more meaningful competitive analysis and allows retailers to understand how pricing changes across DIY, bulk, and professional purchasing situations.
Part 3: Solve Assortment Planning and Contractor Demand Intelligence Gaps
Home improvement catalogs contain thousands of products spanning tools, hardware, appliances, flooring, lighting, plumbing, electrical supplies, outdoor products, building materials, and seasonal merchandise. Managing such a broad assortment manually makes it difficult to identify emerging demand and competitive gaps.
Structured product information allows businesses to categorize products according to brand, category, subcategory, specifications, dimensions, materials, ratings, pack sizes, price ranges, and availability. This creates a consistent foundation for comparing products across categories.
Contractor demand requires additional attention because professional buyers often purchase according to project requirements rather than individual consumer preferences. Quantity, durability, specifications, compatibility, availability, and total project cost can influence purchasing decisions.
- Product Availability — Suggested KPI: In-stock % | Strategic Use: Replenishment.
- Price Movement — Suggested KPI: Weekly price change | Strategic Use: Pricing strategy.
- Bulk Products — Suggested KPI: Pack-size share | Strategic Use: Pro assortment.
- Special-Order Items — Suggested KPI: Special-order ratio | Strategic Use: Supply planning.
- Category Coverage — Suggested KPI: SKU count/category | Strategic Use: Assortment analysis.
- Local Availability — Suggested KPI: Store coverage % | Strategic Use: Regional strategy.
Businesses can combine these indicators to identify categories with strong competitive activity and products that deserve deeper monitoring. A sudden price decrease across several competing products could indicate promotional pressure. Increasing availability of project-specific products may signal seasonal demand preparation. Repeated stockouts can indicate supply constraints or strong regional demand.
Another useful application is assortment gap analysis. If competitors consistently carry certain product types, sizes, brands, or pack quantities that a retailer lacks, the gap can become a potential expansion opportunity.
Historical datasets also allow companies to distinguish temporary events from persistent market trends. A one-day price change may have limited strategic value, while repeated changes across several weeks can indicate a meaningful competitive movement.
With consistent monitoring, retailers can move from reactive assortment decisions toward data-supported planning, improving product selection while reducing unnecessary inventory exposure.
How Web Fusion Data Can Help You?
Web Fusion Data can help businesses transform large volumes of publicly available ecommerce information into structured, analysis-ready intelligence. E-commerce Data Scraping enables organizations to systematically monitor product details, pricing, availability, promotions, specifications, and other relevant signals across complex home improvement catalogs.
Instead of manually checking hundreds or thousands of product pages, businesses can establish repeatable collection workflows and organize the information into standardized fields. This makes it easier to compare products, detect changes, and build historical datasets for strategic analysis.
Key ways the approach can support home improvement businesses include:
- Monitor product prices and identify meaningful competitive movements.
- Track availability patterns across selected geographic locations.
- Compare package sizes and calculate effective unit economics.
- Identify products with changing specifications or assortment attributes.
- Detect promotional changes and seasonal pricing behavior.
- Build historical records for forecasting and competitive analysis.
The resulting E-Commerce Datasets can support pricing teams, category managers, procurement professionals, retailers, distributors, and contractor-focused businesses. By combining product, pricing, inventory, and demand signals, organizations can create a more complete picture of the home improvement market and make decisions using consistent, structured intelligence rather than isolated observations.
Conclusion
E-commerce Data Scraping gives home improvement businesses a practical way to monitor the factors that influence ecommerce performance, including local availability, product pricing, bulk economics, special-order products, and assortment changes. When these signals are collected consistently, businesses can identify competitive gaps, improve pricing decisions, strengthen inventory planning, and better understand regional and contractor-oriented demand.
The broader goal is to turn scattered marketplace information into actionable E-Commerce Data Intelligence with Web Fusion Data, supporting faster and more informed business decisions. From competitive benchmarking to assortment optimization, helps businesses leverage structured market monitoring to respond effectively to changing customer needs and evolving pricing conditions.
Source: https://www.webfusiondata.com/home-depot-ecommerce-data-scraping.php
Contact us:
E-mail: [email protected]
Phone No: +1 424 3777584
Visit Now: https://www.webfusiondata.com/
