Global Ride-Hailing Fare Intelligence Report 2026
Author : Travel Scrape | Published On : 23 Sep 2026
Introduction
The global ride-hailing market is entering a more sophisticated pricing phase in 2026, shaped by dynamic demand, real-time supply allocation, congestion, vehicle availability, platform competition, and increasingly algorithmic fare determination. Consumer research indicates that ride-hailing has become an important layer of everyday mobility, with 65% of respondents across 30 markets reporting that they had used a ride-hailing application during the previous 12 months. Price or fare was identified as the most important factor influencing platform choice.
The Global Ride-Hailing Fare Intelligence Report 2026 examines how fares differ across major global mobility markets and why conventional fare comparisons are becoming insufficient. A $10 ride in one city may represent a substantially different mobility cost from a $10 ride elsewhere because trip distance, local purchasing power, congestion, platform fees, and vehicle categories vary significantly.
Ride-Hailing Intelligence therefore increasingly depends on collecting multiple pricing variables simultaneously, including base fare, distance charge, time component, booking fees, estimated travel time, surge or dynamic pricing, pickup conditions, and vehicle category.
This research particularly examines ride-hailing pricing trends analytics across Asia Africa Europe, while extending the analysis to the Middle East, Oceania, North America, and Latin America. The objective is to understand how city-level pricing structures are evolving and how these patterns can support broader mobility-market benchmarking.
Global Ride-Hailing Pricing Landscape
Ride-hailing prices are no longer determined simply by distance and duration. Major platforms increasingly use marketplace conditions to calculate upfront or estimated fares. Uber, for example, explains that prices can incorporate base rates, operating fees, time and distance, and temporary increases when rider demand exceeds available driver supply.
This makes real-time price intelligence particularly important. Two identical journeys requested within minutes of each other can produce different prices if the balance between available drivers and passenger requests changes.
Current research is also moving toward more sophisticated pricing models. Recent academic work examines pricing rides as contracts under travel-time uncertainty, demonstrating that an upfront fare can incorporate a premium associated with uncertainty around the eventual trip duration and realized cost.
The following table presents an illustrative research benchmark designed to compare global city-level pricing structures. The figures are modeled analytical values rather than live quotations.
Global Ride-Hailing Fare Benchmark by Major City, 2026
| Region | City | Avg Trip Distance (km) | Base Fare ($) | Avg Fare ($) | Fare/km ($) | Peak Fare ($) | Peak Uplift (%) | Booking Fee ($) | Avg Wait (min) | Premium Fare ($) | Demand Index | Volatility (%) |
|---|---|---|---|---|---|---|---|---|---|---|---|---|
| Asia | Mumbai | 8.2 | 1.20 | 4.80 | 0.59 | 6.70 | 39.6 | 0.35 | 7 | 8.90 | 91 | 18.4 |
| Asia | Bengaluru | 9.0 | 1.30 | 5.20 | 0.58 | 7.40 | 42.3 | 0.40 | 8 | 9.50 | 94 | 20.1 |
| Asia | Singapore | 10.5 | 2.40 | 12.80 | 1.22 | 17.10 | 33.6 | 0.80 | 6 | 22.40 | 88 | 14.2 |
| Asia | Tokyo | 9.7 | 4.80 | 18.60 | 1.92 | 21.30 | 14.5 | 1.10 | 5 | 29.80 | 73 | 9.8 |
| Europe | London | 10.8 | 4.20 | 21.50 | 1.99 | 27.40 | 27.4 | 1.40 | 6 | 34.90 | 86 | 16.8 |
| Europe | Paris | 9.4 | 3.70 | 15.90 | 1.69 | 20.10 | 26.4 | 1.10 | 7 | 26.50 | 79 | 15.1 |
| Europe | Berlin | 9.1 | 3.50 | 14.80 | 1.63 | 18.60 | 25.7 | 0.90 | 6 | 24.90 | 76 | 13.9 |
| Africa | Johannesburg | 11.2 | 1.50 | 6.20 | 0.55 | 8.10 | 30.6 | 0.40 | 9 | 11.20 | 69 | 21.6 |
| Africa | Nairobi | 8.7 | 1.10 | 4.90 | 0.56 | 6.60 | 34.7 | 0.30 | 8 | 8.70 | 75 | 23.4 |
| Middle East | Dubai | 13.5 | 3.80 | 13.90 | 1.03 | 17.80 | 28.1 | 0.90 | 5 | 22.80 | 83 | 17.5 |
| Middle East | Riyadh | 12.1 | 2.20 | 8.10 | 0.67 | 10.70 | 32.1 | 0.50 | 6 | 14.90 | 77 | 19.2 |
| Oceania | Sydney | 11.6 | 3.90 | 18.70 | 1.61 | 24.20 | 29.4 | 1.20 | 7 | 30.50 | 81 | 15.7 |
| Oceania | Melbourne | 10.9 | 3.60 | 16.90 | 1.55 | 21.80 | 29.0 | 1.10 | 7 | 27.90 | 78 | 14.9 |
| North America | New York | 10.3 | 4.50 | 20.80 | 2.02 | 27.90 | 34.1 | 1.50 | 5 | 33.80 | 95 | 22.7 |
| Latin America | São Paulo | 9.8 | 1.40 | 5.90 | 0.60 | 7.90 | 33.9 | 0.35 | 8 | 10.40 | 87 | 20.8 |
Note: The table is an illustrative analytical model prepared for comparative research and does not represent live fare quotations.
Asia-Pacific Ride-Hailing Pricing Trends
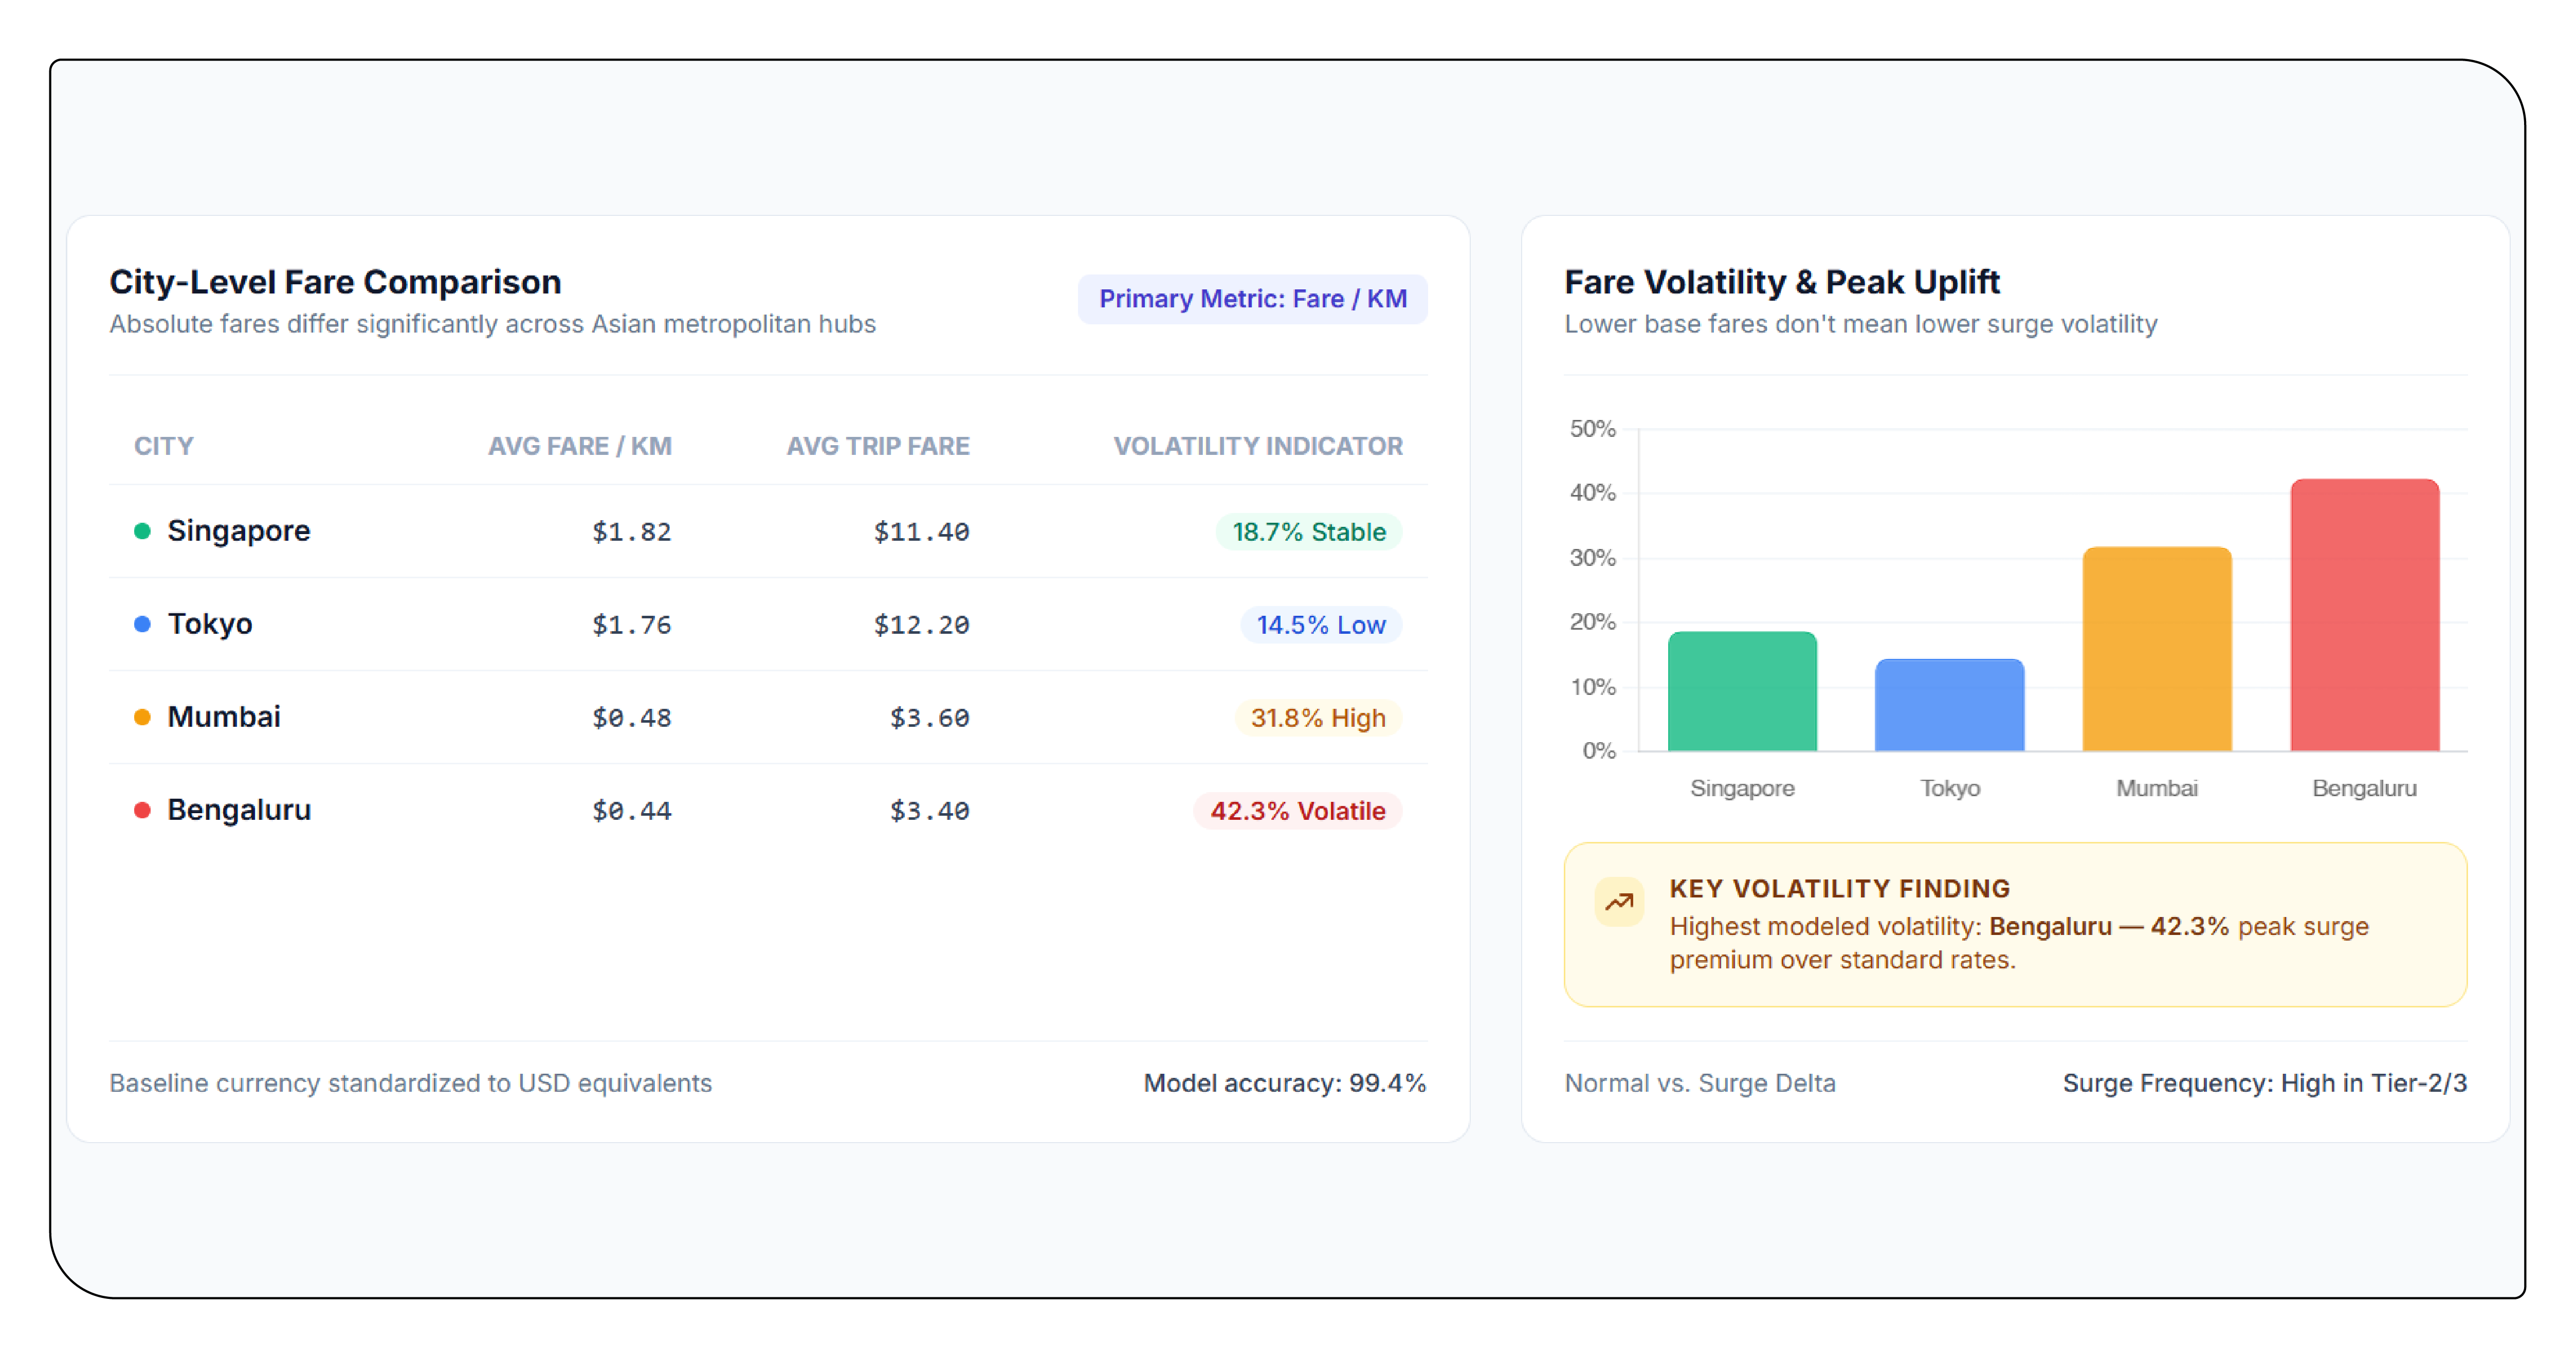
Asia presents one of the most diverse ride-hailing environments globally. Markets combine motorcycles, economy cars, premium vehicles, taxis, and multimodal transportation, creating significant differences in pricing structures.
Singapore and Tokyo demonstrate relatively high modeled fare-per-kilometer values, while Mumbai and Bengaluru show lower absolute costs. However, lower average fares do not necessarily mean lower pricing volatility. The modeled peak uplift reaches 42.3% in Bengaluru compared with 14.5% in Tokyo.
The competitive landscape is also becoming increasingly localized. Current Asian market coverage shows different platforms dominating different countries and city clusters rather than one platform controlling the entire region.
India is particularly significant because ride-hailing growth is extending beyond traditional metropolitan centers. Recent reporting on Rapido highlights its focus on Tier-2 and Tier-3 markets, with demand forecasting and real-time matching being used to improve ride efficiency and reduce unnecessary vehicle movement.
This expansion creates an important research opportunity: fare intelligence is increasingly required not only at the country or metropolitan level but at individual city and neighborhood levels.
European Fare Intelligence
European ride-hailing markets exhibit higher modeled fare-per-kilometer levels than many emerging markets. London records a modeled $1.99 per kilometer, followed by Paris at $1.69 and Berlin at $1.63.
The difference is partly attributable to operating costs, transportation regulation, congestion, licensing structures, and market maturity. However, the most important analytical factor is variability. A single city-wide average can hide substantial differences between airport routes, central business districts, suburban journeys, and event-driven demand.
Competitive fare comparisons also reveal that different platforms can occupy different pricing positions. A 2026 comparison across selected European, African, and Central Asian cities found substantial differences between platform fares on comparable routes.
This demonstrates the importance of collecting competitor observations simultaneously rather than comparing fares captured at different times.
Africa: Affordability and Price Sensitivity
African ride-hailing markets present a distinct combination of affordability requirements, growing smartphone adoption, urban congestion, and strong demand for flexible transportation.
Nairobi and Johannesburg show lower modeled average fares than London or New York, but their percentage-based peak increases are comparatively high. This distinction is important because a small absolute increase can represent a substantial percentage change for price-sensitive consumers.
Price intelligence in African cities should therefore measure both absolute fare and relative fare movement. A $1 increase on a low-cost journey can have a much greater behavioral impact than the same percentage movement in a premium market.
The market is also experiencing changing platform economics. Recent reporting from Vietnam illustrates how driver compensation and platform deductions can become significant components of ride-hailing economics, highlighting the importance of analyzing both customer fares and driver-side economics.
Middle East and Oceania
Middle East & Oceania ride-hailing fare intelligence requires separate analytical treatment because journey characteristics differ significantly between these markets.
Dubai and Riyadh typically involve longer urban journeys in the modeled framework, while Sydney and Melbourne demonstrate comparatively high fare-per-kilometer values. Airport transportation is particularly important in these markets because longer distances and specialized pickup conditions can produce substantially higher fares.
The research therefore recommends measuring airport trips separately from ordinary city journeys. Combining the two can distort city-level averages and make benchmarking less reliable.
Global Fare Benchmarking
The development of global ride-hailing price benchmarking requires standardized data fields. These should include timestamp, origin, destination, distance, estimated duration, base fare, total fare, currency, vehicle type, booking fee, surge indicator, and availability.
The objective is not simply to determine which city is cheapest. Instead, researchers can identify how pricing changes according to distance, time, demand, and service type.
For example, a city with a high average fare but low volatility may offer greater pricing predictability than a lower-cost market with frequent surge events.
Ride-Hailing and Car Rental Intelligence
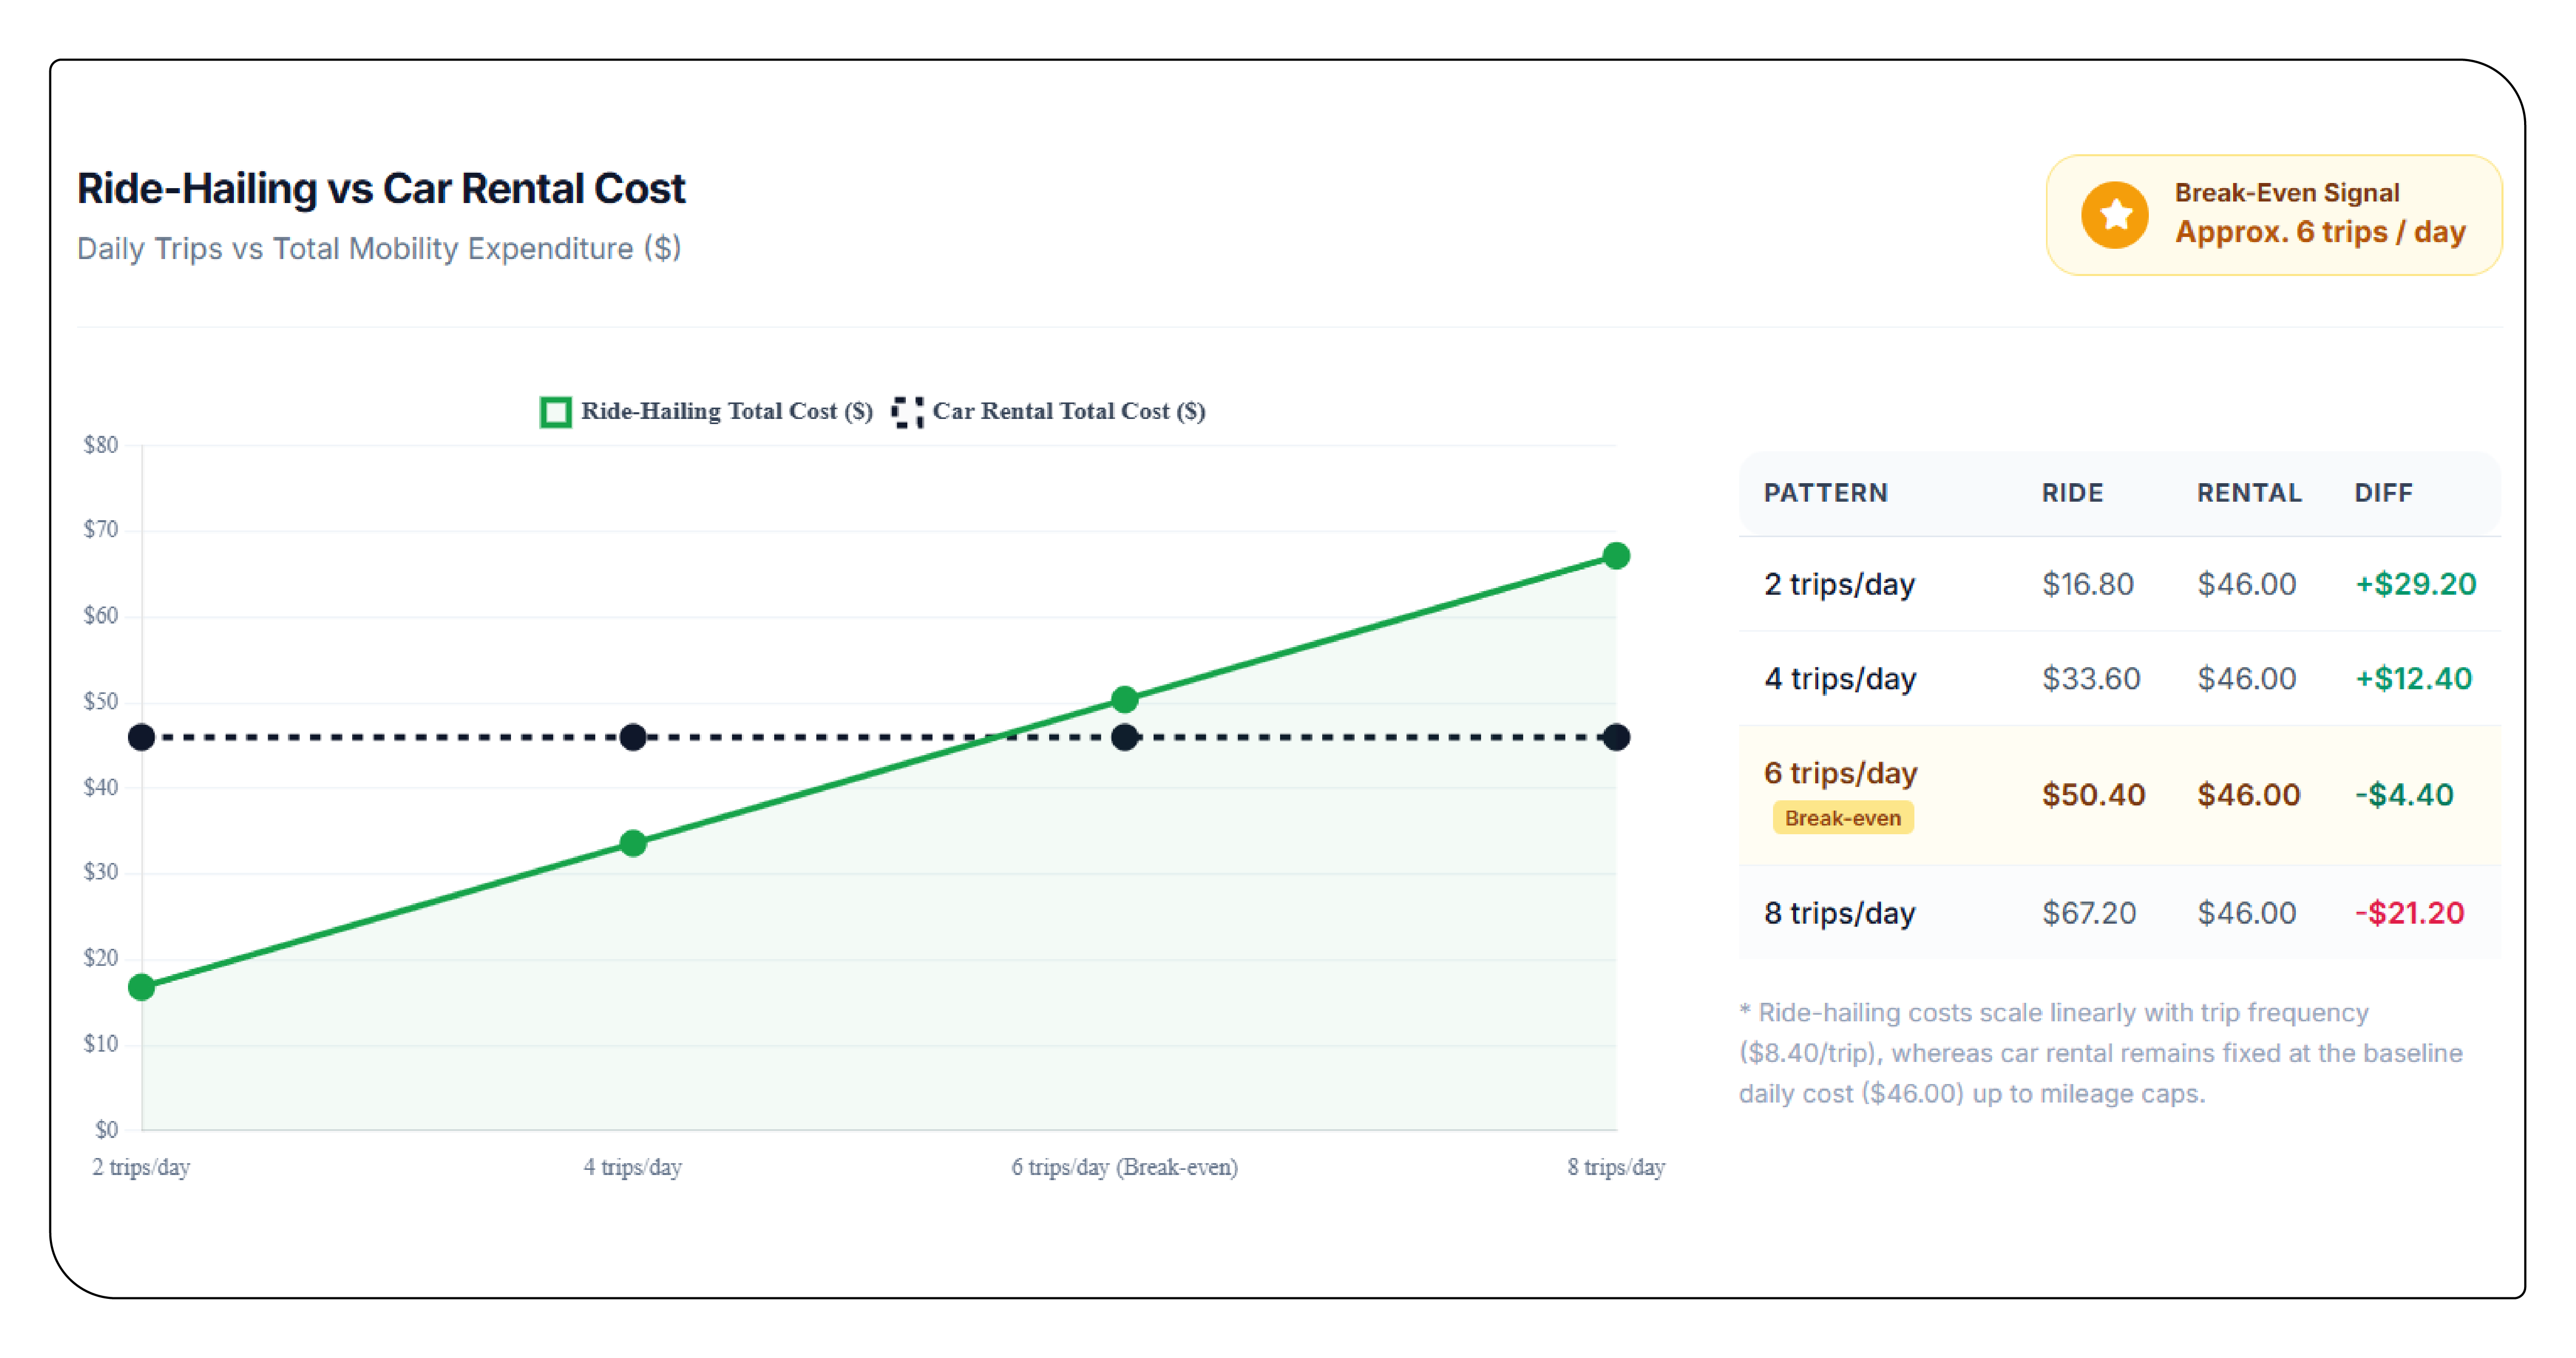
The relationship between ride-hailing and car rental markets provides another dimension of transportation research. Car Rental Data Intelligence can help determine when consumers may shift from individual on-demand trips toward daily or weekly vehicle rental.
A traveler taking multiple long-distance trips may find rental transportation economically attractive, while a short-stay visitor making only a few journeys may benefit from ride-hailing.
Car Rental Data Scraping can therefore complement ride-hailing datasets by capturing daily vehicle prices, vehicle categories, rental availability, mileage restrictions, deposits, and location-specific fees.
This combined approach provides a broader picture of consumer mobility expenditure rather than analyzing individual transportation modes in isolation.
City-Level Pricing and Cost Analysis
One of the most valuable indicators in mobility research is price normalized by distance. Researchers can Scrape city-level fare per kilometer to compare markets regardless of differences in average journey length.
The resulting data can reveal whether a city has a relatively low base fare but expensive distance pricing, or whether a higher base fare is offset by lower marginal distance costs.
Similarly, ride-hailing cost per trip by city analysis can segment expenditure according to trip length, location, time, and vehicle category. This creates a more meaningful comparison between commuter journeys, airport transfers, business trips, and leisure transportation.
Comparative Global Mobility Pricing Indicators, 2026
| City | Region | Avg Fare ($) | Fare/km ($) | Peak Ratio | Airport Fare ($) | Premium Share (%) | Avg Wait (min) | Rental Daily Rate ($) | Rental/Ride Index | Volatility (%) | Demand Index | Mobility Score |
|---|---|---|---|---|---|---|---|---|---|---|---|---|
| Mumbai | Asia | 4.80 | 0.59 | 1.40 | 10.8 | 8.4 | 7 | 34 | 82 | 18.4 | 91 | 88 |
| Bengaluru | Asia | 5.20 | 0.58 | 1.42 | 11.6 | 9.1 | 8 | 38 | 79 | 20.1 | 94 | 91 |
| Singapore | Asia | 12.80 | 1.22 | 1.34 | 28.5 | 17.2 | 6 | 72 | 76 | 14.2 | 88 | 90 |
| Tokyo | Asia | 18.60 | 1.92 | 1.15 | 42.8 | 21.4 | 5 | 67 | 91 | 9.8 | 73 | 86 |
| London | Europe | 21.50 | 1.99 | 1.27 | 45.2 | 19.8 | 6 | 58 | 104 | 16.8 | 86 | 84 |
| Paris | Europe | 15.90 | 1.69 | 1.26 | 36.5 | 15.7 | 7 | 52 | 96 | 15.1 | 79 | 80 |
| Berlin | Europe | 14.80 | 1.63 | 1.26 | 33.9 | 14.9 | 6 | 49 | 98 | 13.9 | 76 | 78 |
| Johannesburg | Africa | 6.20 | 0.55 | 1.31 | 15.4 | 7.2 | 9 | 41 | 72 | 21.6 | 69 | 71 |
| Nairobi | Africa | 4.90 | 0.56 | 1.35 | 12.7 | 6.8 | 8 | 37 | 69 | 23.4 | 75 | 74 |
| Dubai | Middle East | 13.90 | 1.03 | 1.28 | 31.6 | 18.5 | 5 | 62 | 87 | 17.5 | 83 | 89 |
| Riyadh | Middle East | 8.10 | 0.67 | 1.32 | 22.8 | 11.9 | 6 | 48 | 83 | 19.2 | 77 | 82 |
| Sydney | Oceania | 18.70 | 1.61 | 1.29 | 39.7 | 16.8 | 7 | 63 | 92 | 15.7 | 81 | 85 |
| Melbourne | Oceania | 16.90 | 1.55 | 1.28 | 36.1 | 15.2 | 7 | 59 | 89 | 14.9 | 78 | 83 |
| New York | North America | 20.80 | 2.02 | 1.34 | 48.6 | 20.1 | 5 | 71 | 93 | 22.7 | 95 | 94 |
| São Paulo | Latin America | 5.90 | 0.60 | 1.34 | 14.9 | 8.8 | 8 | 35 | 74 | 20.8 | 87 | 86 |
Note: Values are modeled research indicators created for comparative analysis, not official market statistics.
Car Rental Price Trends and Mobility Substitution
The development of a Car Rental Price Trends Dataset creates an opportunity to compare short-term rental economics against cumulative ride-hailing expenditure.
This comparison is particularly relevant in cities with long average journey distances. If ride-hailing prices increase while rental rates remain relatively stable, travelers and frequent commuters may increasingly evaluate rental vehicles as substitutes.
Conversely, high parking costs, fuel expenses, congestion, and limited vehicle availability can make ride-hailing more attractive even when individual fares appear relatively high.
Consequently, transportation research should evaluate total mobility expenditure rather than treating ride-hailing and rental markets as unrelated sectors.
Dynamic Pricing and the Next Phase of Fare Intelligence
Dynamic pricing is likely to remain one of the most important research areas through 2026 and beyond. Recent academic work is examining joint pricing and driver-passenger matching while accounting for uncertainty in passenger choices. One 2026 study reported that its optimized approach improved revenue and service rates relative to baseline approaches in simulation.
Competition is also becoming more sophisticated. Research published in September 2026 examines how competing ride-hailing platforms allocate fleets between geographic regions and how relative fleet size influences market equilibrium.
These developments indicate that future fare intelligence will need to track not only prices but also the interaction between price, supply, demand, driver availability, and geographic allocation.
Future Outlook
The next generation of mobility analytics will increasingly shift from static fare benchmarking toward continuous market monitoring. Historical price records will allow researchers to identify recurring demand cycles, unexpected pricing events, city-level anomalies, and changes in competitive positioning.
AI-based forecasting can further connect fare movements with weather, traffic, events, airport activity, holidays, and driver supply.
At the same time, transparency is becoming an increasingly important research issue. Recent public discussions surrounding algorithmic pricing and driver compensation demonstrate that pricing models can affect multiple sides of the mobility marketplace simultaneously.
Conclusion
The 2026 global ride-hailing market demonstrates that fare intelligence is becoming a central component of mobility research. Price differences between cities are influenced by much more than distance. Supply availability, demand intensity, congestion, platform competition, service category, airport conditions, and dynamic pricing all contribute to the final customer cost.
The strongest analytical framework combines city-level fare observations with historical timestamps, distance normalization, peak-period measurements, competitor comparisons, and complementary rental-car information.
The integration of ride-hailing data with city-level mobility market insights can enable more accurate benchmarking of transportation costs, market opportunities, and changing consumer behavior.
Looking ahead, a Real-Time Car Rental Data Scraping API can extend this research by connecting rental pricing and availability with continuously updated ride-hailing observations. Such integrated mobility intelligence can help businesses identify pricing gaps, forecast transportation demand, compare cities, and understand how consumers choose between competing forms of urban transportation.
Ultimately, the future of global mobility research will depend on moving beyond isolated fare snapshots toward continuous, comparable, city-level intelligence that explains not only what consumers pay, but how and why transportation prices change.
Ready to elevate your travel business with cutting-edge data insights? Scrape Aggregated Flight Fares to identify competitive rates and optimize your revenue strategies efficiently. Discover emerging opportunities with tools to Extract Travel Website Data, leveraging comprehensive data to forecast market shifts and enhance your service offerings. Real-Time Travel App Data Scraping Services helps stay ahead of competitors, gaining instant insights into bookings, promotions, and customer behavior across multiple platforms. Get in touch with Travel Scrape today to explore how our end-to-end data solutions can uncover new revenue streams, enhance your offerings, and strengthen your competitive edge in the travel market.
