Geopolitical Risk Monitoring Platform: Building a Watchlist Your Team Will Actually Use
Author : Industry Insights | Published On : 13 Nov 2026
Analysts who follow conflict, trade and energy at the same time usually end up with too many tabs and not enough structure. A geopolitical risk monitoring platform is meant to solve that, and GeoMoney Intelligence Platform was built around the idea that the hard part is not collecting signals but deciding which ones deserve attention on any given morning. This article sets out a practical way to use one.
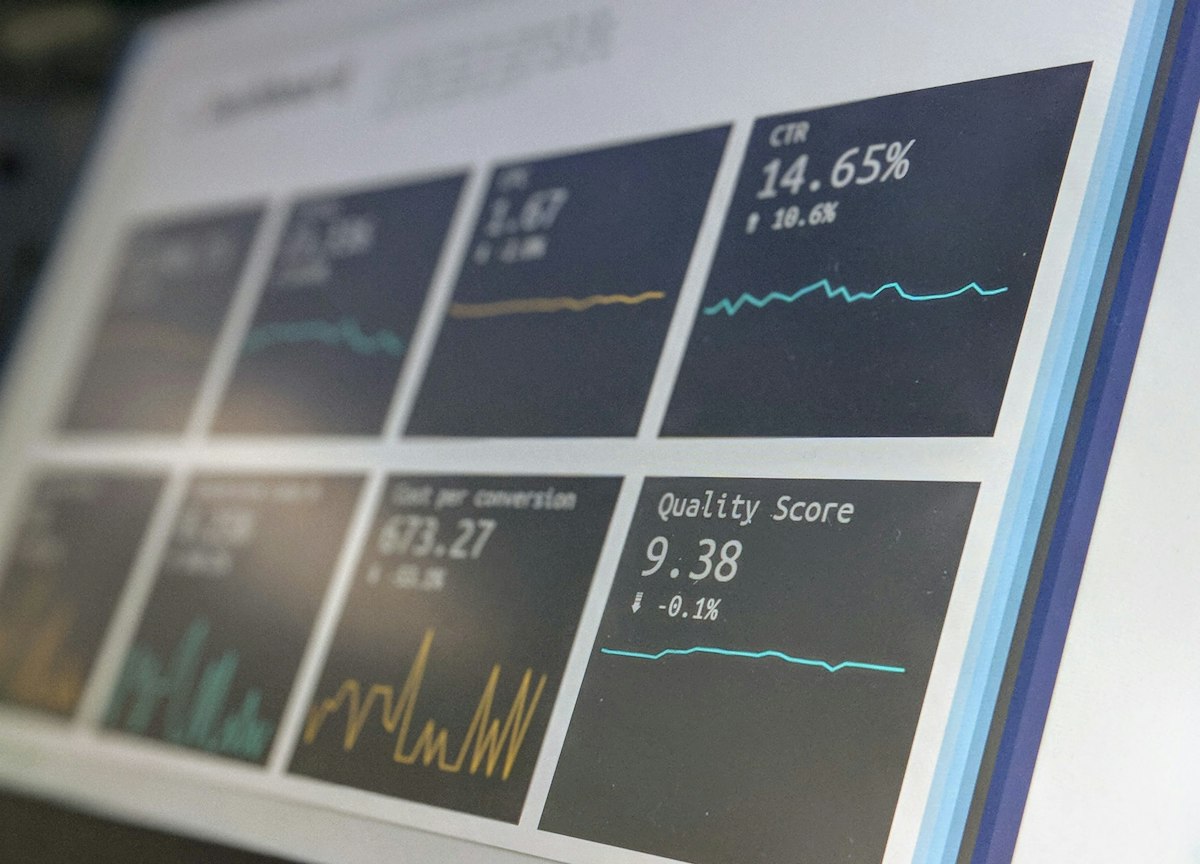
The aim is not to predict events. It is to notice sooner, describe more precisely, and avoid reacting to noise.
What a Monitoring Platform Is Actually For
Most teams do not lack information. They lack a way to tell a meaningful change from a busy news cycle. A monitoring platform earns its place when it turns scattered reports into a small number of watchable indicators: shipping movements through a chokepoint, a change in export licensing, a shift in military activity, a sudden divergence between a physical price and its benchmark.
The first thing to decide is what you are monitoring for. A manufacturer watching input costs needs different alerts from a fund watching sovereign risk. Write down the three decisions your team actually makes — hedge or wait, reroute or absorb, enter or hold — and build the monitor around those. A dashboard that is not tied to a decision becomes background noise within a fortnight.
The second thing to decide is cadence. Some signals deserve a daily glance, some a weekly review, and some only matter when a threshold is crossed. Mixing these together is the most common reason monitoring routines collapse: everything arrives at once, so nothing is read properly.
Building a Short List of Indicators
Start with no more than a dozen indicators. For each one, write the source, the normal range, and what you would do if it moved. That last column is the discipline that keeps a watchlist honest. If you cannot say what a move would change, the indicator is interesting rather than useful, and it belongs in a reading list instead of a monitor.
Group them into three layers. The slow layer holds structural things: policy direction, sanctions regimes, infrastructure projects, long-term supply contracts. These change rarely but reset the context for everything else. The middle layer holds flows: cargo movements, inventories, export volumes, grid output. The fast layer holds prices and headlines, which move constantly and mean the least in isolation.
Reading them in that order — slow first, fast last — is what stops a single headline from driving a decision. When something in the fast layer moves, the question is whether anything in the slower layers moved first. Most of the time nothing did, and the move is noise. Occasionally something did, and that is the signal worth acting on.
Teams working on raw materials often find that commodity market intelligence fits naturally into the middle layer, because physical flows usually change before quoted prices settle on a new level. The write-up on tracking tankers and shadow fleets is a good example of how a flow indicator is constructed from public data.
A Weekly Routine That Survives Busy Weeks
A routine only works if it still works in a bad week. Keep it short enough that it takes twenty minutes on a Monday morning.
Begin with the slow layer. Has any policy, sanction, licence or contract changed since last week? Note it in one line, with a link. Then look at the flows: which of your middle-layer indicators moved outside its normal range, and by how much? Finally, scan prices and headlines, and ask whether they are consistent with what the first two layers told you.
Close the review by writing two or three sentences describing the current state in plain language, and keep them. Over a few months that running commentary becomes more valuable than any individual chart, because it shows how your own reading changed and where it was wrong. Teams that keep this record argue less about what they expected, since the record says so.
When something does cross a threshold, the routine shifts. The first forty-eight hours of a supply shock are mostly about separating confirmed facts from repetition, which the guide on reading the first forty-eight hours covers in more detail. The temptation in those hours is to refresh constantly. The better habit is to fix a check-in interval and hold to it.
Judging Whether the Platform Is Earning Its Place
After a quarter, review the monitor itself rather than the markets. Which indicators prompted a decision? Which were never looked at? Which alerts fired often and changed nothing? Cut what did not earn its place, even if it was interesting, and add at most two replacements.
Ask also whether the platform helped you describe risk to people outside the team. Good geopolitical risk analysis is readable by a non-specialist: it names what changed, what it affects, and what would have to happen next for the picture to change again. If your outputs need a long preamble before anyone can use them, the problem is usually structure rather than data.
Finally, check how much of the routine depends on one person. A monitor that only its author can read is a single point of failure. Write down the sources and the thresholds so that a colleague can run the Monday review without you, and test that by having them do it once. The checklist on evaluating a platform through a short pilot sets out a fair way to run that test before committing to a tool for the year.
Common Mistakes Worth Avoiding
Three patterns account for most failed monitoring efforts. The first is tracking everything, which produces a dashboard nobody reads. The second is confusing frequency with importance, so the fastest-moving number gets the most attention. The third is treating the monitor as a forecast: a well-built watchlist tells you what has changed, not what will happen, and a team that expects prediction will abandon it the first time an event arrives unannounced.
A fourth, less obvious mistake is never revising thresholds. Normal ranges drift. An alert calibrated last winter may be firing constantly by summer, and once alerts are routinely ignored the monitor has effectively stopped working. Revisit the numbers at the same time each quarter.
Keep the whole thing modest in scope. A dozen indicators, three layers, one short weekly review and a quarterly clean-up will outperform an elaborate system that nobody maintains. The point is to notice the things that matter a little earlier than you otherwise would, and to be able to say clearly why they matter.
