Extract Sleeper & Luxury Bus Segment Pricing Report 2026
Author : Travel Scrape | Published On : 28 Sep 2026
Introduction
India's intercity bus market is entering a more data-driven pricing phase in 2026. Passenger demand is expanding, premium bus formats are becoming more visible, and online distribution is making fare differences easier for travelers to discover. redBus's latest BusTrack data estimates 147.19 million intercity passengers travelled between October 2025 and March 2026, while gross ticketing value reached ₹142.16 billion, up 20% year over year.
The market is also becoming increasingly premium. redBus data shows that 72% of journeys in the October 2025–March 2026 period were on AC buses, compared with 67% in the corresponding previous period. Sleeper buses accounted for 52% of journeys by bus type, while hybrid formats represented 34% and seaters 14%.
Extract Sleeper & Luxury Bus Segment Pricing Report 2026 to provide a framework for understanding how fares differ by route, operator, bus configuration, departure timing, occupancy, seat position, and booking window.
Bus Data Scraping enables these variables to be collected repeatedly from online booking platforms and transformed into structured pricing intelligence.
Premium intercity bus fares monitoring is particularly important because a single route can display substantially different prices for similar departure times, while premium berths may command significantly higher prices as availability tightens.
The report evaluates the pricing structure of sleeper and luxury services, identifies important 2026 pricing signals, and demonstrates how operators, OTAs, mobility platforms, and investors can use structured fare intelligence.
2026 Market Landscape
The underlying intercity market provides a strong foundation for premium pricing. VIDEC estimated more than 5,000 private operators and approximately 25 state transport corporations running more than 100,000 intercity bus services daily in FY24. Around 40% of the intercity fleet was AC, with typical AC fares of approximately ₹900–₹1,100 outside seasonal peaks.
The online channel is becoming increasingly important. VIDEC projected online intercity bus bookings to rise from ₹100 billion in FY23 to ₹176 billion by FY26, increasing online penetration from 19% to 26%.
This shift matters for premium buses because digital marketplaces make fare discovery immediate. A passenger comparing five operators can see differences based on berth design, amenities, departure time, boarding location, cancellation rules, and remaining inventory.
The premium segment therefore cannot be evaluated simply by asking, "What is the average sleeper fare?" The more useful question is: how does price change as route conditions and available inventory change?
Sleeper and Luxury Fare Benchmark
The following benchmark combines published route-level examples with derived comparisons. It is intended to demonstrate the structure of a pricing intelligence dataset rather than represent a complete national fare census.
| Route | Service Type | Published/Benchmark Fare (₹) | Distance Band (km) | Approx. ₹/100 km | Premium vs Non-AC* | Indicative Journey Hours | Pricing Position |
|---|---|---|---|---|---|---|---|
| Bhopal–Sagar | Sleeper | 333 | 175 | 190 | 32.1% | 4.0 | Budget Sleeper |
| Bhopal–Sagar | AC | 329 | 175 | 188 | 30.4% | 4.0 | Standard Premium |
| Indore–Jaipur | Sleeper | 1,300 | 600 | 217 | 71.3% | 10.5 | Premium Sleeper |
| Indore–Jaipur | AC | 1,200 | 600 | 200 | 58.0% | 10.5 | Premium AC |
| Ahmedabad–Pune | Sleeper | 1,899 | 660 | 288 | 75.8% | 12.0 | Long-Haul Sleeper |
| Ahmedabad–Pune | AC | 2,299 | 660 | 348 | 112.9% | 12.0 | Luxury AC |
| Guwahati–Tezpur | Sleeper | 351 | 180 | 195 | -22.0% | 4.5 | Value Sleeper |
| Bhuj–Baroda | Sleeper | 1,203 | 530 | 227 | 41.5% | 9.0 | Premium Sleeper |
| Bhuj–Baroda | AC | 990 | 530 | 187 | 16.5% | 9.0 | Standard AC |
| New Delhi–Manali | AC Sleeper | 1,300 | 530 | 245 | 60.5%** | 13.0 | Premium Sleeper |
| New Delhi–Manali | AC Sleeper | 1,510 | 530 | 285 | 86.4%** | 13.0 | Upper Premium |
*Premium comparison uses the non-AC benchmark where available.
**Comparison based on an ₹810 AC-seater benchmark reported for the route.
Published fare evidence from Chartered Speed/Frost & Sullivan shows sleeper fares of ₹333.33 on Bhopal–Sagar, ₹1,300 on Indore–Jaipur, ₹1,899 on Ahmedabad–Pune, ₹351 on Guwahati–Tezpur, and ₹1,203 on Bhuj–Baroda.
The New Delhi–Manali market provides another useful illustration: current 2026 listings show fares reaching ₹1,510 for luxury, business, and sleeper services, while AC sleeper examples range from ₹1,080 to ₹1,510 depending on operator and service.
What Is Driving Sleeper Pricing in 2026?
Fare Fluctuation Alerts are becoming increasingly useful because premium fares are not necessarily static throughout a booking cycle.
The first major factor is departure demand. Friday evenings, Sunday returns, holidays, festivals, and long weekends generally create stronger demand than ordinary midweek departures. A premium sleeper with 30–36 berths can move from moderate availability to near-capacity much faster than a larger conventional bus.
The second factor is booking lead time. A passenger booking several days ahead may encounter a lower introductory price, whereas a customer booking immediately before departure may face a higher fare if inventory is constrained.
The third factor is seat location. Front-row berths, lower berths, single berths, window positions, and seats near premium facilities can carry different prices. Consequently, a route-level average can conceal significant seat-level variation.
The fourth factor is bus specification. A basic AC sleeper, Volvo-style premium coach, luxury sleeper, semi-sleeper, and hybrid coach should not be treated as interchangeable products.
Sleeper Pricing Trends and Competitive Positioning
Sleeper bus pricing trends analysis shows that comfort has increasingly become a monetizable product attribute rather than merely an operational feature.
A premium sleeper can command higher prices when it combines overnight travel, greater privacy, charging facilities, better suspension, onboard entertainment, blankets, washrooms, refreshments, or premium boarding locations.
Recent route examples illustrate how dramatically pricing can vary. On Indore–Jaipur, the cited sleeper fare of ₹1,300 is approximately ₹541 higher than the ₹759 non-AC fare. On Ahmedabad–Pune, the ₹1,899 sleeper fare is ₹819 above the ₹1,080 non-AC benchmark.
However, premium pricing does not automatically mean higher revenue. If an operator raises fares too aggressively, occupancy can decline. The optimal strategy is therefore a balance between yield per berth and occupancy percentage.
A useful revenue metric is:
Revenue per departure = Average realized fare × Occupied berths
For example, a 36-berth sleeper operating at 80% occupancy with a ₹1,400 average realized fare generates approximately ₹40,320 in ticket revenue. At 95% occupancy with a ₹1,600 fare, revenue rises to ₹54,720. This demonstrates why controlled dynamic pricing can potentially improve revenue without requiring additional departures.
Sleeper & Luxury Competitive Intelligence
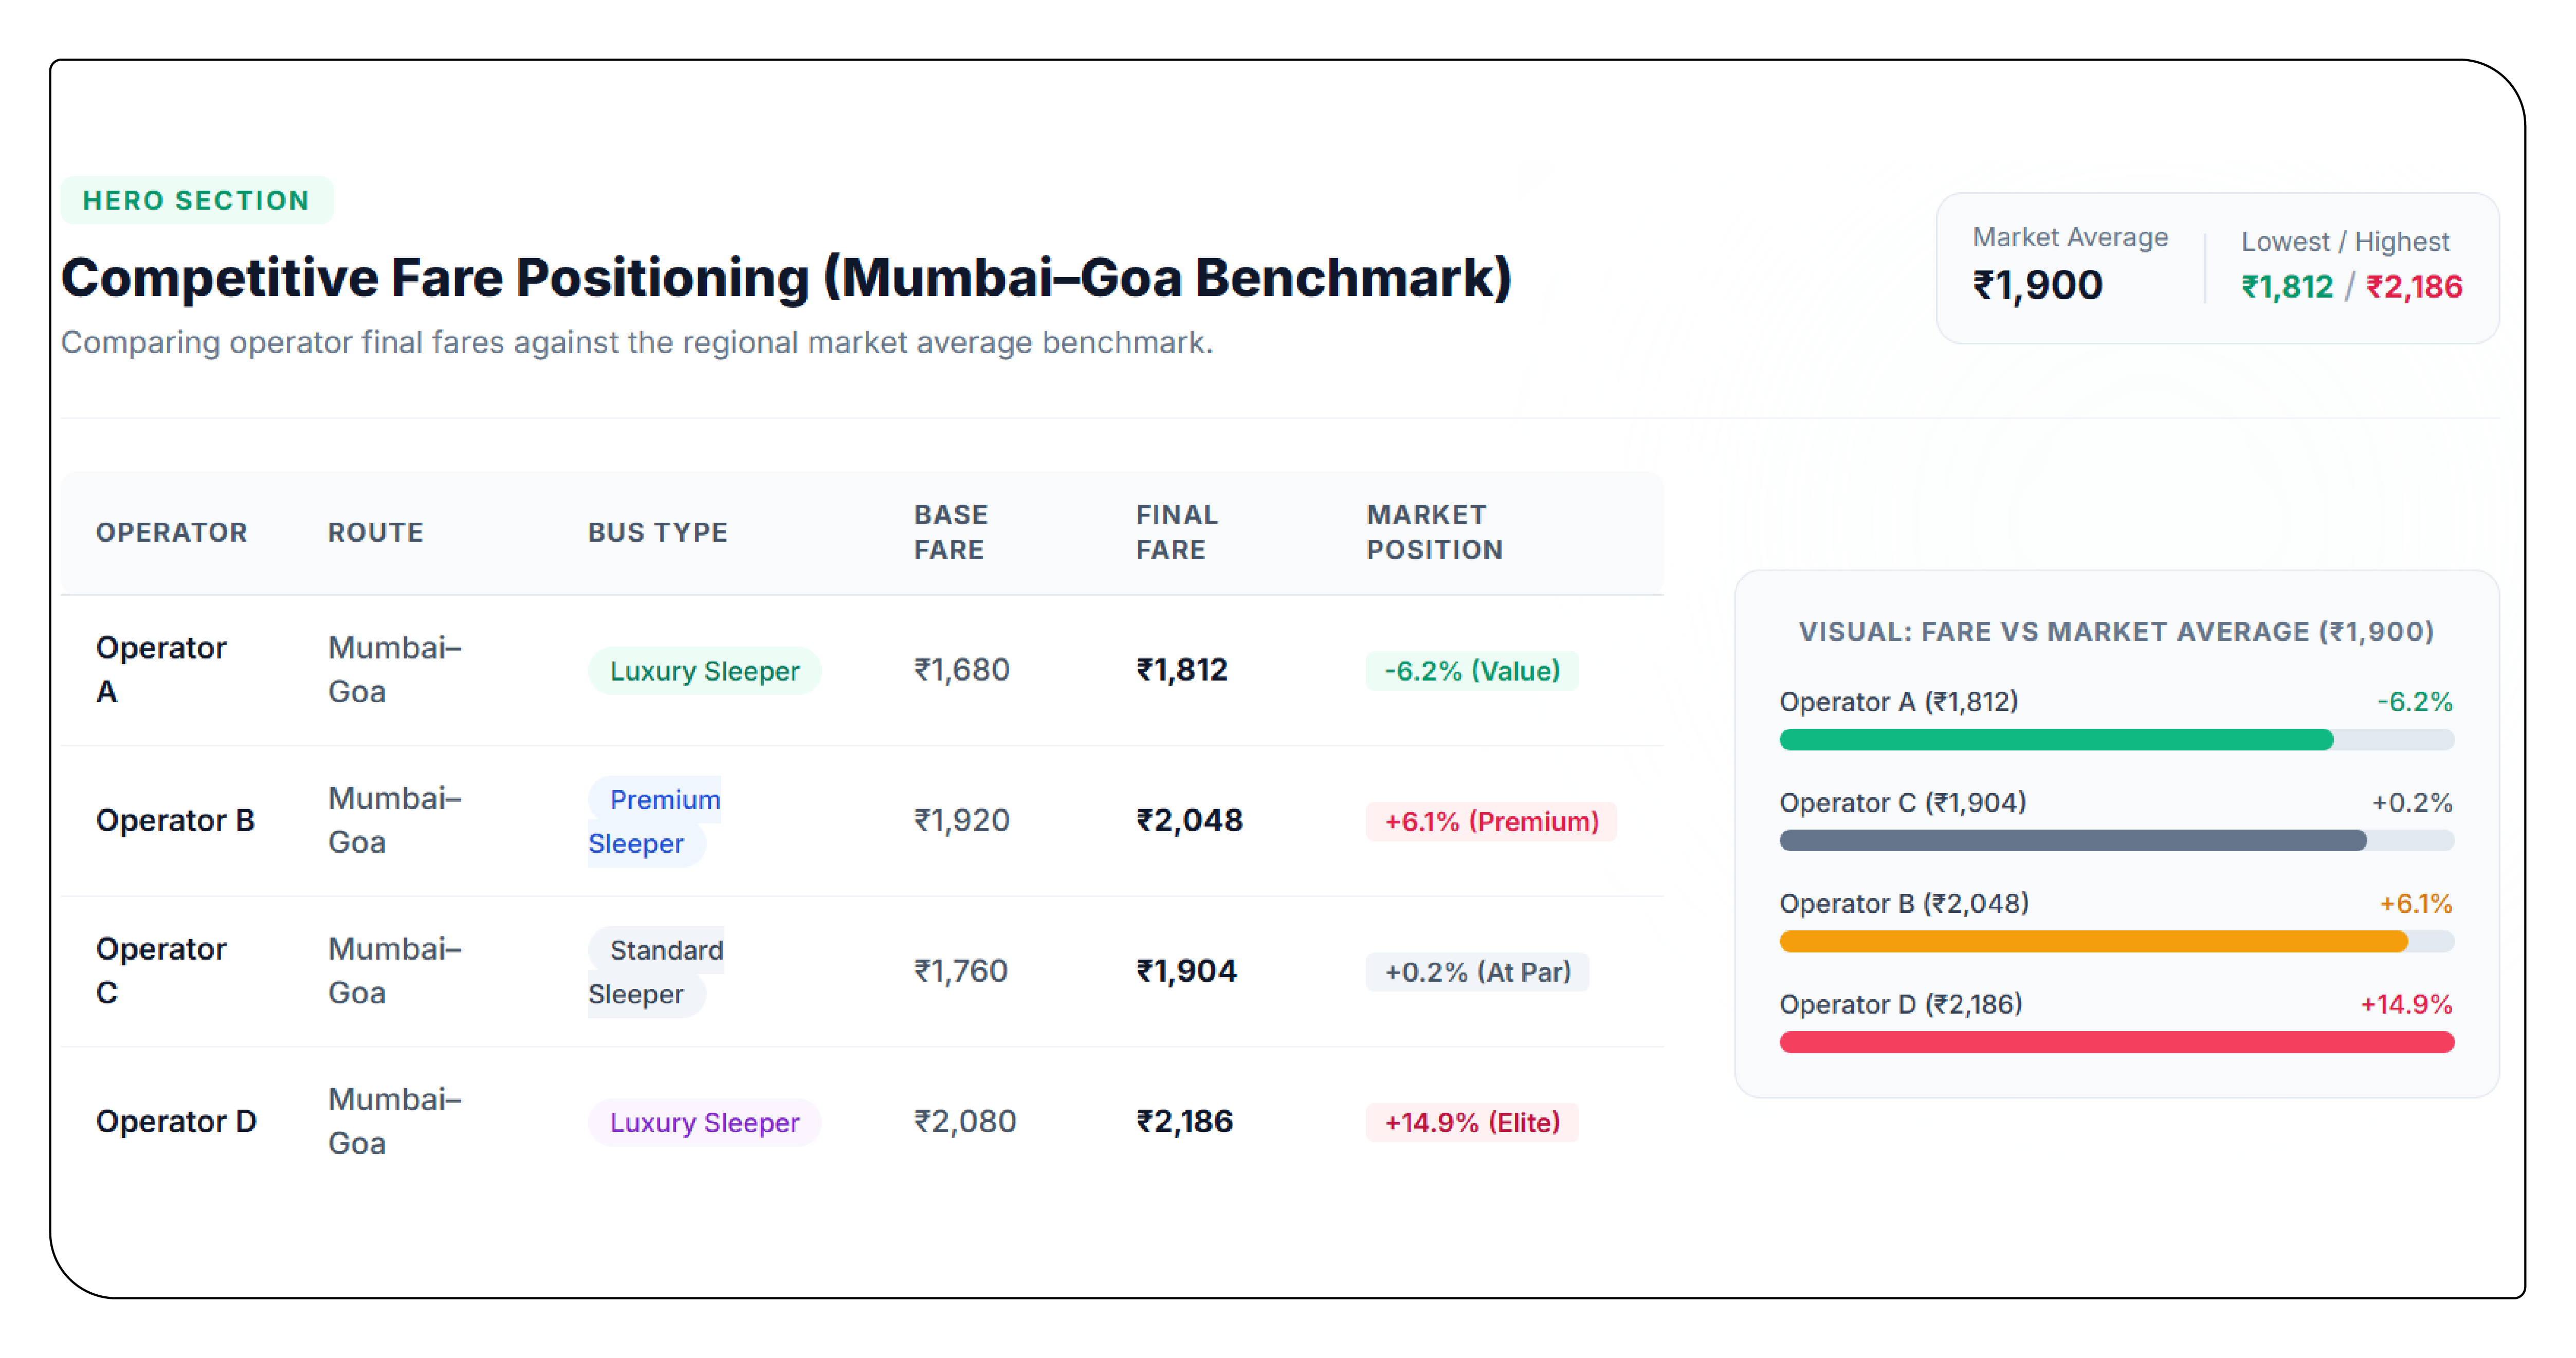
Sleeper & Luxury bus pricing intelligence becomes more valuable when operators stop looking only at their own fares.
Competitive monitoring should capture operator name, route, departure time, arrival time, bus category, seat type, base fare, taxes, convenience fees, discounts, boarding point, dropping point, seat availability, cancellation conditions, and booking timestamp.
The resulting dataset can answer questions such as:
- Which operator consistently undercuts the market?
- Which routes support the highest sleeper premium?
- How quickly do premium berths disappear?
- Which departures experience the largest price increases?
- Are luxury buses charging more because of genuine differentiation?
- Which operators maintain stable prices despite high demand?
This moves analysis from simple fare collection to competitive decision-making.
Route-Level Pricing Benchmark
Sleeper & Luxury bus fare comparison dataset should ideally maintain historical snapshots instead of storing only today's price.
A robust dataset can compare the same route at multiple intervals before departure. The following is an illustrative analytical structure showing how such a dataset can be interpreted.
| Route | Bus Category | Initial Fare ₹ | 7-Day Fare ₹ | 3-Day Fare ₹ | 24-Hour Fare ₹ | Peak Fare ₹ | Occupancy at Peak | Fare Increase % | Avg. Daily Change ₹ | Price Volatility Index | Estimated Revenue/Departure ₹ |
|---|---|---|---|---|---|---|---|---|---|---|---|
| Delhi–Manali | AC Sleeper | 1,080 | 1,180 | 1,300 | 1,400 | 1,510 | 94% | 39.8% | 61 | 8.4 | 51,048 |
| Delhi–Jaipur | Premium Sleeper | 650 | 720 | 790 | 850 | 920 | 91% | 41.5% | 38 | 7.8 | 30,139 |
| Mumbai–Goa | Luxury Sleeper | 1,200 | 1,350 | 1,500 | 1,650 | 1,850 | 96% | 54.2% | 72 | 11.2 | 63,936 |
| Bengaluru–Hyderabad | Premium Sleeper | 1,000 | 1,100 | 1,250 | 1,400 | 1,600 | 93% | 60.0% | 67 | 12.1 | 53,568 |
| Pune–Bengaluru | Luxury Sleeper | 1,100 | 1,200 | 1,350 | 1,500 | 1,700 | 92% | 54.5% | 67 | 10.8 | 56,508 |
| Ahmedabad–Mumbai | AC Sleeper | 850 | 920 | 1,000 | 1,080 | 1,200 | 89% | 41.2% | 39 | 8.2 | 36,936 |
| Chennai–Bengaluru | Premium Sleeper | 700 | 760 | 820 | 900 | 980 | 90% | 40.0% | 31 | 7.4 | 32,760 |
| Hyderabad–Vijayawada | AC Sleeper | 650 | 700 | 760 | 820 | 900 | 88% | 38.5% | 31 | 6.9 | 28,512 |
| Delhi–Lucknow | Luxury Sleeper | 900 | 980 | 1,080 | 1,200 | 1,350 | 93% | 50.0% | 50 | 9.7 | 45,198 |
| Mumbai–Ahmedabad | Premium Sleeper | 750 | 810 | 880 | 950 | 1,050 | 87% | 40.0% | 33 | 7.2 | 32,886 |
The figures in this table are illustrative modeling values designed to show how a historical pricing dataset can be structured; they should not be interpreted as verified live fares.
The Role of Price Monitoring
Price Monitoring allows companies to move from occasional competitor checks to continuous market observation.
For an operator, monitoring competitor prices can reveal whether a fare increase is commercially sustainable. For an OTA, it can identify unusual price gaps between platforms. For an investor or market researcher, historical observations can reveal route-level monetization patterns.
The strongest monitoring systems capture data at fixed intervals—for example, every 30 minutes, hourly, or several times per day—and maintain historical snapshots.
This makes it possible to calculate minimum fare, maximum fare, median fare, average fare, percentage movement, price dispersion, and fare changes during the final 24 hours before departure.
Route-Level Analytics and Availability
Route-level bus pricing analytics connects fare movement with route characteristics.
A route should be evaluated according to distance, travel duration, departure time, seasonality, competition, operator concentration, bus configuration, and demand intensity.
For example, a 500-kilometre overnight journey may support a substantially higher sleeper premium than a similarly priced daytime route because travelers are purchasing both transportation and accommodation-like convenience.
Availability adds another layer.
Luxury & sleeper bus seat availability data scraping can identify the exact number of available berths, occupied seats, blocked seats, seat categories, and price differences between berth positions.
Combining price and availability creates an important signal: fare acceleration. If availability falls from 40% to 15% while fares rise by 25%, the route is exhibiting strong demand pressure. If availability remains high while prices rise, the increase may instead reflect an operator-level pricing decision.
Key 2026 Pricing Patterns
Several patterns stand out from the available market evidence.
Premiumization: AC and premium formats are gaining share. The redBus BusTrack report recorded AC journeys at 72% in October 2025–March 2026, up from 67% in the comparable period.
Sleeper dominance: Sleeper services represented 52% of journeys by bus type in the same BusTrack dataset, indicating the importance of overnight and comfort-focused products.
Regional concentration: South and West India remain particularly important intercity markets, together accounting for roughly three-fourths of intercity bus gross booking value according to VIDEC.
Higher online visibility: Greater digital distribution makes price differences easier for customers to compare and therefore increases competitive pressure.
Dynamic opportunity: Premium sleeper pricing can increasingly be managed according to booking velocity, remaining inventory, departure proximity, and historical demand rather than a single fixed tariff.
Business Applications
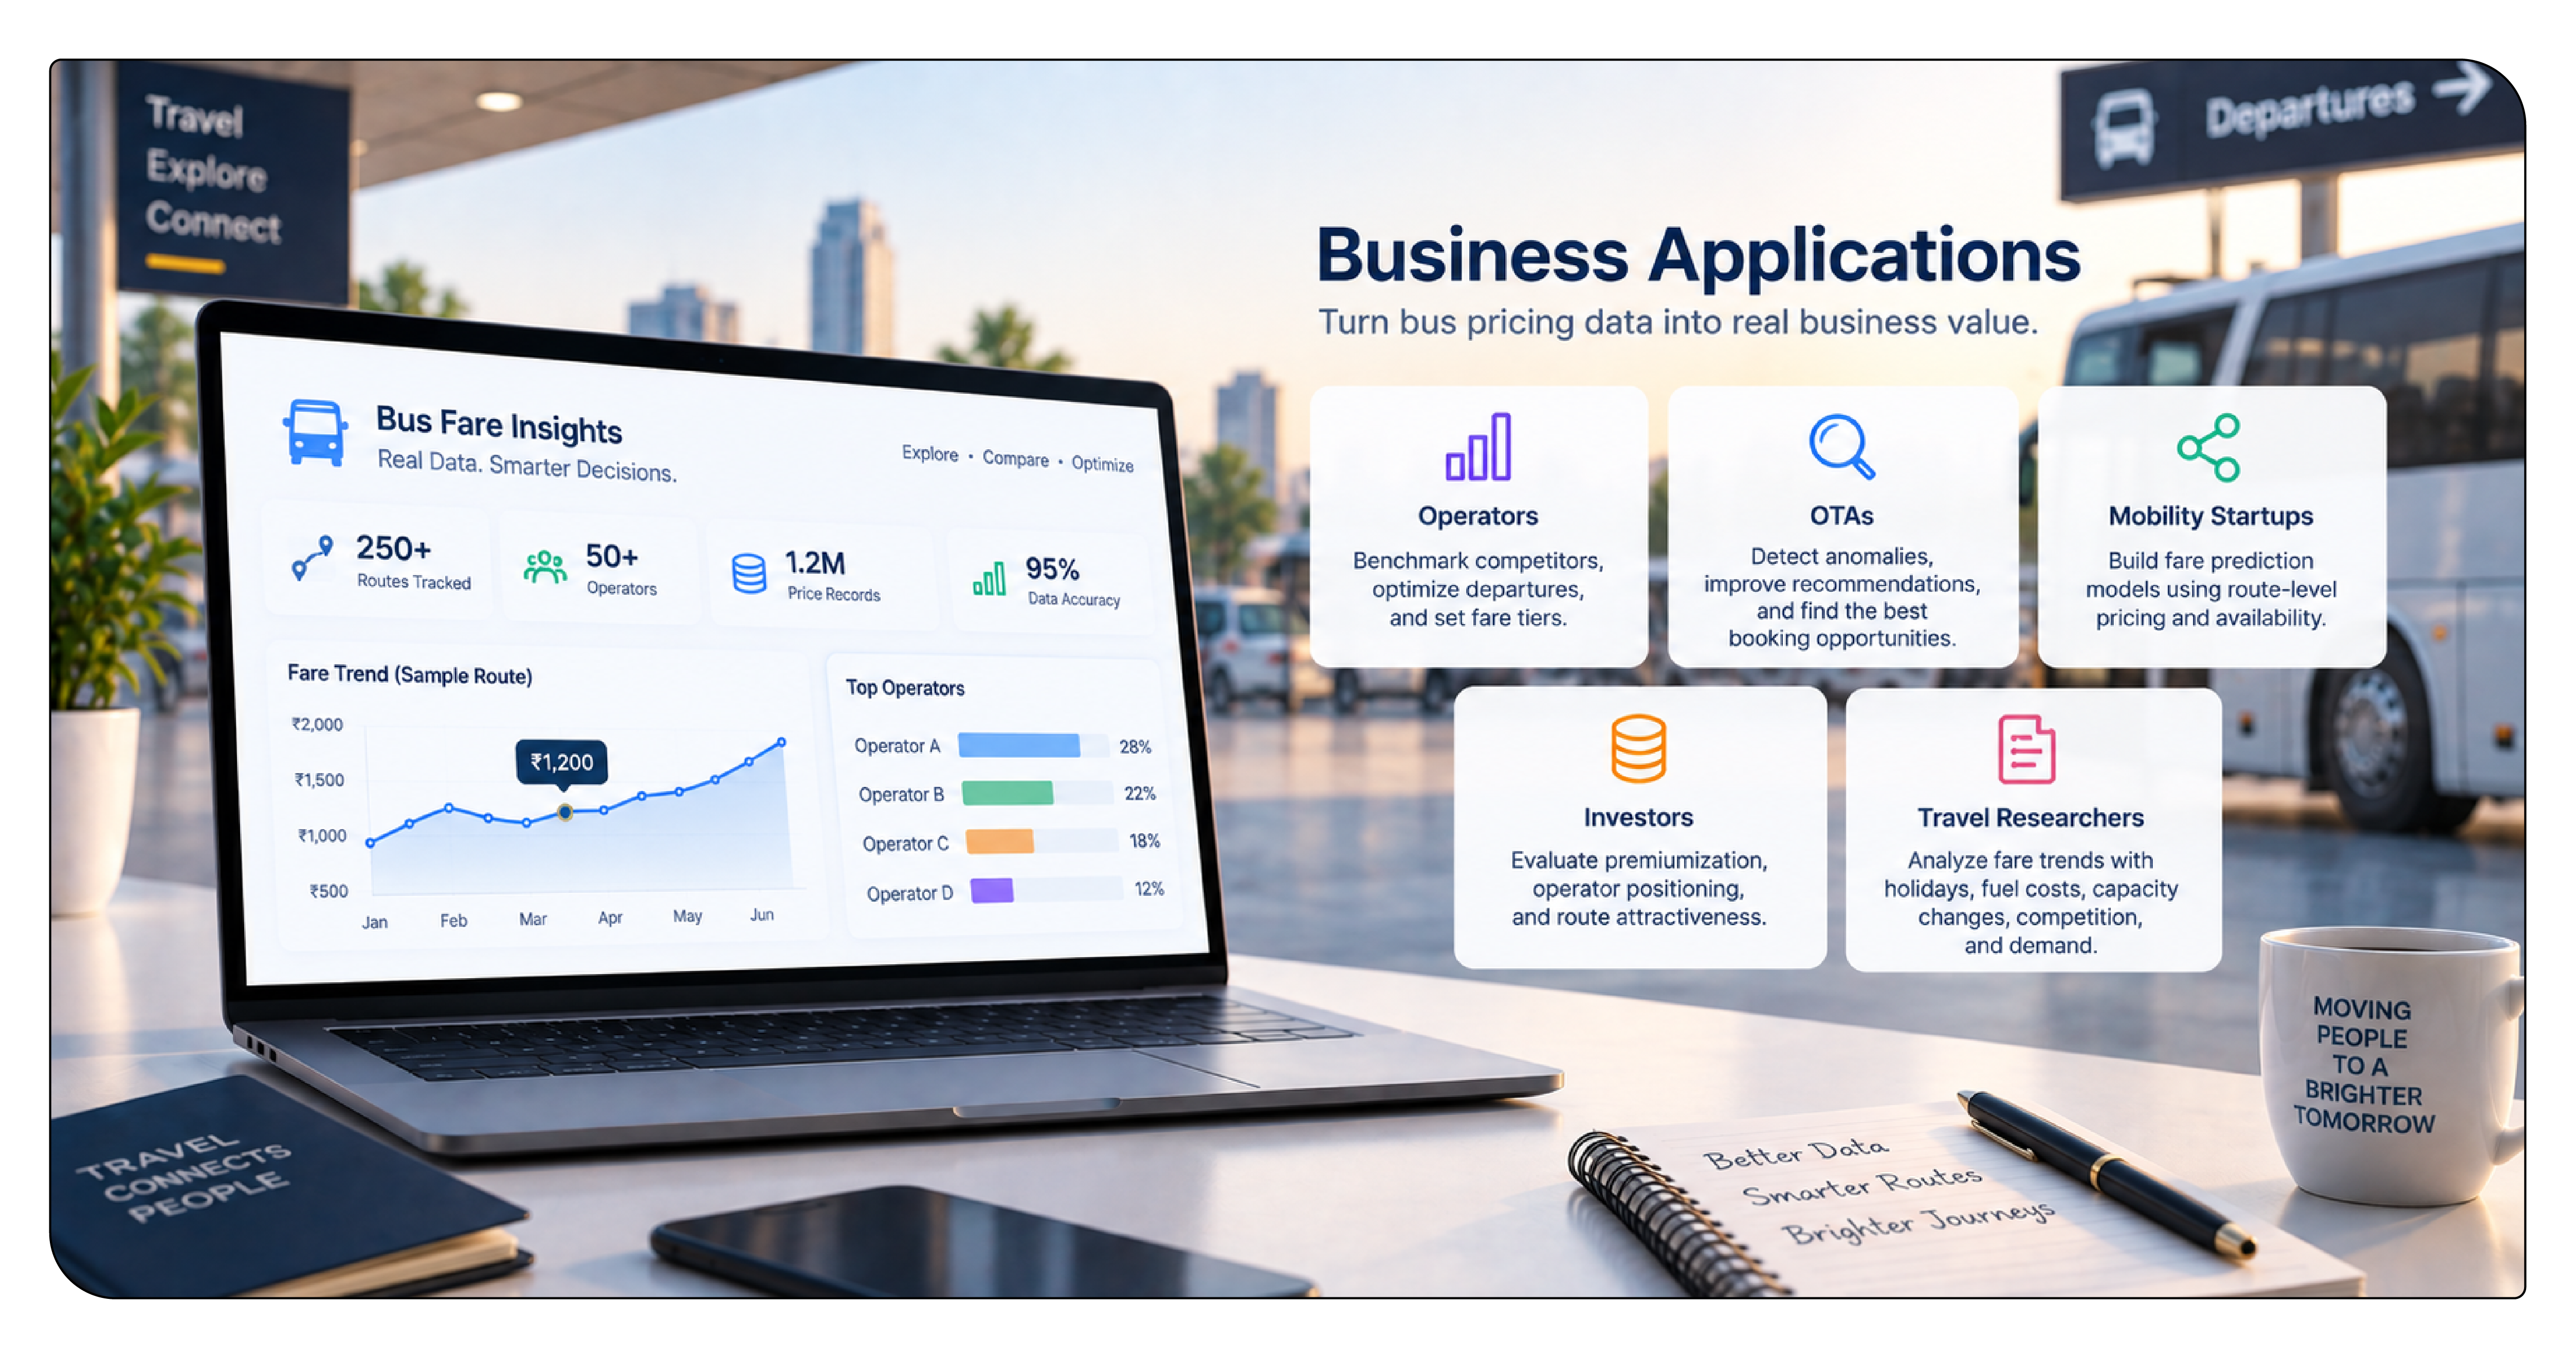
A structured 2026 pricing dataset can support several commercial decisions.
Operators can use it to benchmark competitors, identify underpriced routes, optimize peak departures, and establish differentiated fare tiers.
OTAs can use historical prices to detect anomalies, improve recommendation engines, and identify the most competitive booking opportunities.
Mobility startups can use route-level pricing and availability to construct fare prediction models.
Investors can evaluate premiumization, operator positioning, route attractiveness, and pricing power.
Travel researchers can study how bus fares respond to holidays, fuel costs, capacity changes, competition, and regional demand.
The greatest value comes from combining fare + availability + time + route + operator rather than analyzing price alone.
Conclusion
The sleeper and luxury bus segment is becoming a sophisticated pricing market in 2026. Growing passenger volumes, expanding AC adoption, increased online booking, and greater product differentiation are creating more opportunities for data-led pricing strategies. redBus estimates 147.19 million intercity passengers travelled during October 2025–March 2026, reinforcing the scale of the market.
The key opportunity is not simply collecting today's fares. Businesses need historical observations that show how fares move as inventory, departure proximity, demand, and competition change.
A comprehensive intelligence framework should therefore combine operator-level fares, seat-level availability, route characteristics, booking windows, bus categories, and historical price movements.
Booking Trend Insights can then be generated from the combined dataset to identify demand acceleration, high-value routes, premium pricing windows, occupancy-driven fare increases, and opportunities for better revenue management.
For 2026, the competitive advantage will increasingly belong to organizations that can convert continuously collected bus-market data into actionable pricing decisions rather than relying on occasional manual fare comparisons.
Ready to elevate your travel business with cutting-edge data insights? Scrape Aggregated Flight Fares to identify competitive rates and optimize your revenue strategies efficiently. Discover emerging opportunities with tools to Extract Travel Website Data, leveraging comprehensive data to forecast market shifts and enhance your service offerings. Real-Time Travel App Data Scraping Services helps stay ahead of competitors, gaining instant insights into bookings, promotions, and customer behavior across multiple platforms. Get in touch with Travel Scrape today to explore how our end-to-end data solutions can uncover new revenue streams, enhance your offerings, and strengthen your competitive edge in the travel market.
Source: https://www.travelscrape.com/extract-sleeper-luxury-bus-segment-pricing-report.php
Original: https://www.travelscrape.com
